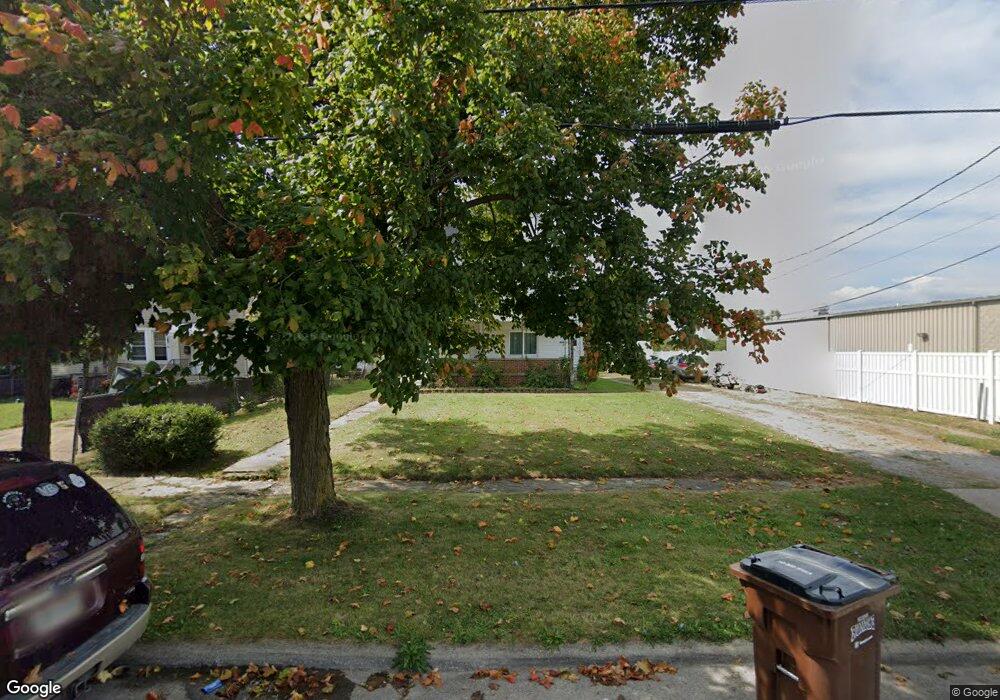
405 Putnam St Sandusky, OH 44870
Estimated Value: $149,000 - $223,000
5
Beds
3
Baths
2,673
Sq Ft
$66/Sq Ft
Est. Value
About This Home
This home is located at 405 Putnam St, Sandusky, OH 44870 and is currently estimated at $175,804, approximately $65 per square foot. 405 Putnam St is a home located in Erie County with nearby schools including Sandusky High School, Monroe Preparatory Academy, and Sandusky Central Catholic School.
Ownership History
Date
Name
Owned For
Owner Type
Purchase Details
Closed on
Apr 18, 2022
Sold by
Balduff Andrew T and Balduff Sarah A
Bought by
Keegan David James
Current Estimated Value
Home Financials for this Owner
Home Financials are based on the most recent Mortgage that was taken out on this home.
Original Mortgage
$108,007
Outstanding Balance
$102,218
Interest Rate
5%
Mortgage Type
New Conventional
Estimated Equity
$73,586
Purchase Details
Closed on
Oct 23, 2018
Sold by
Balduff Sherryl L
Bought by
Balduff Andrew T and Balduff Sarah A
Home Financials for this Owner
Home Financials are based on the most recent Mortgage that was taken out on this home.
Original Mortgage
$65,600
Interest Rate
4.6%
Mortgage Type
New Conventional
Purchase Details
Closed on
May 1, 2015
Sold by
Balduff Sherryl L and Balduff James Edward
Bought by
Balduff Sherry L
Purchase Details
Closed on
Nov 5, 1998
Sold by
Asberry Erma
Bought by
Baldoff James E and Baldoff Sherryl
Home Financials for this Owner
Home Financials are based on the most recent Mortgage that was taken out on this home.
Original Mortgage
$37,200
Interest Rate
6.72%
Mortgage Type
New Conventional
Create a Home Valuation Report for This Property
The Home Valuation Report is an in-depth analysis detailing your home's value as well as a comparison with similar homes in the area
Home Values in the Area
Average Home Value in this Area
Purchase History
| Date | Buyer | Sale Price | Title Company |
|---|---|---|---|
| Keegan David James | $375 | Fidelity National Title | |
| Balduff Andrew T | $82,000 | Fidelity National Title | |
| Balduff Sherry L | -- | None Available | |
| Baldoff James E | $46,500 | -- |
Source: Public Records
Mortgage History
| Date | Status | Borrower | Loan Amount |
|---|---|---|---|
| Open | Keegan David James | $108,007 | |
| Previous Owner | Balduff Andrew T | $65,600 | |
| Previous Owner | Baldoff James E | $37,200 |
Source: Public Records
Tax History Compared to Growth
Tax History
| Year | Tax Paid | Tax Assessment Tax Assessment Total Assessment is a certain percentage of the fair market value that is determined by local assessors to be the total taxable value of land and additions on the property. | Land | Improvement |
|---|---|---|---|---|
| 2024 | $1,424 | $36,165 | $5,792 | $30,373 |
| 2023 | $1,424 | $35,535 | $4,630 | $30,905 |
| 2022 | $1,801 | $35,535 | $4,630 | $30,905 |
| 2021 | $1,818 | $35,540 | $4,630 | $30,910 |
| 2020 | $1,528 | $27,450 | $4,630 | $22,820 |
| 2019 | $1,571 | $27,450 | $4,630 | $22,820 |
| 2018 | $1,573 | $27,450 | $4,630 | $22,820 |
| 2017 | $1,509 | $26,260 | $4,980 | $21,280 |
| 2016 | $996 | $26,260 | $4,980 | $21,280 |
| 2015 | $901 | $26,260 | $4,980 | $21,280 |
| 2014 | $896 | $26,260 | $4,980 | $21,280 |
| 2013 | $887 | $26,260 | $4,980 | $21,280 |
Source: Public Records
Map
Nearby Homes
- 1017 Putnam St
- 1014 Jay St
- 1318 Mills St
- 1319 Tiffin Ave
- 1813 Sandusky St
- 934 W Washington St Unit 2B
- 934 W Washington St Unit 1A
- 1204 W Monroe St
- 621 Mcdonough St
- 1329 Carr St
- 1413 Seneca St
- 1225 Polk St
- 613 W Washington St
- 610 W Washington St
- 1317 Stone St
- 516 W Washington St
- 912 Central Ave
- 417 W Water St
- 1805 Mills St
- 427 Jackson St
- 407 Putnam St
- 411 Putnam St
- 419 Putnam St
- 414 Mills St
- 1826 W Adams St
- 412 Putnam St
- 421 Putnam St
- 1818 W Adams St
- 429 Putnam St
- 418 Putnam St
- 424 Mills St
- 418 Mills St
- 1911 W Jefferson St
- 1917 W Jefferson St
- 422 Putnam St
- 1907 W Jefferson St
- 1919 W Jefferson St
- 435 Putnam St
- 1814 W Adams St
- 426 Mills St