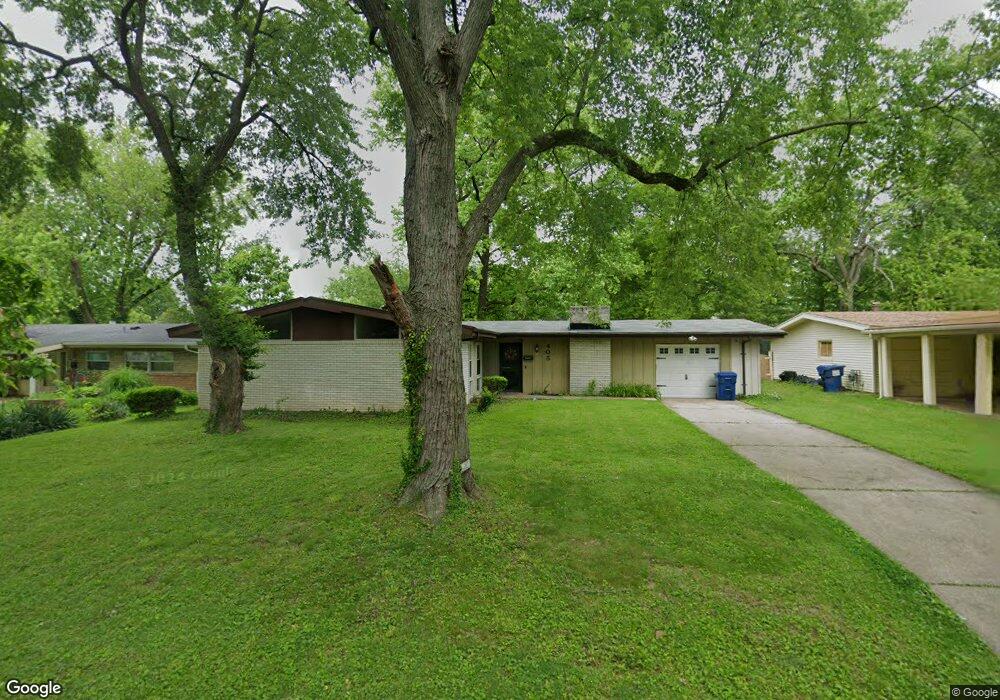
405 Ridge Dr Florissant, MO 63033
Estimated Value: $162,000 - $184,000
3
Beds
2
Baths
1,479
Sq Ft
$118/Sq Ft
Est. Value
About This Home
This home is located at 405 Ridge Dr, Florissant, MO 63033 and is currently estimated at $174,280, approximately $117 per square foot. 405 Ridge Dr is a home located in St. Louis County with nearby schools including Parker Road Elementary School, Cross Keys Middle School, and McCluer North High School.
Ownership History
Date
Name
Owned For
Owner Type
Purchase Details
Closed on
Dec 10, 2002
Sold by
Hud
Bought by
Wallace Latania Y
Current Estimated Value
Home Financials for this Owner
Home Financials are based on the most recent Mortgage that was taken out on this home.
Original Mortgage
$71,811
Outstanding Balance
$30,424
Interest Rate
6.05%
Mortgage Type
FHA
Estimated Equity
$143,856
Purchase Details
Closed on
Jun 25, 2002
Sold by
Homeside Lending Inc
Bought by
Hud
Purchase Details
Closed on
Feb 26, 2002
Sold by
Lewis Cynthia J
Bought by
Homeside Lending Inc
Purchase Details
Closed on
Aug 13, 1999
Sold by
Oconnell Virginia B
Bought by
Lewis Cynthia
Home Financials for this Owner
Home Financials are based on the most recent Mortgage that was taken out on this home.
Original Mortgage
$75,358
Interest Rate
7.68%
Mortgage Type
FHA
Create a Home Valuation Report for This Property
The Home Valuation Report is an in-depth analysis detailing your home's value as well as a comparison with similar homes in the area
Home Values in the Area
Average Home Value in this Area
Purchase History
| Date | Buyer | Sale Price | Title Company |
|---|---|---|---|
| Wallace Latania Y | -- | -- | |
| Hud | -- | -- | |
| Homeside Lending Inc | $78,989 | -- | |
| Lewis Cynthia | $75,400 | -- |
Source: Public Records
Mortgage History
| Date | Status | Borrower | Loan Amount |
|---|---|---|---|
| Open | Wallace Latania Y | $71,811 | |
| Previous Owner | Lewis Cynthia | $75,358 |
Source: Public Records
Tax History Compared to Growth
Tax History
| Year | Tax Paid | Tax Assessment Tax Assessment Total Assessment is a certain percentage of the fair market value that is determined by local assessors to be the total taxable value of land and additions on the property. | Land | Improvement |
|---|---|---|---|---|
| 2025 | $2,141 | $32,050 | $6,840 | $25,210 |
| 2024 | $2,141 | $27,610 | $5,130 | $22,480 |
| 2023 | $2,133 | $27,610 | $5,130 | $22,480 |
| 2022 | $1,988 | $22,610 | $5,130 | $17,480 |
| 2021 | $1,955 | $22,610 | $5,130 | $17,480 |
| 2020 | $1,679 | $18,240 | $3,950 | $14,290 |
| 2019 | $1,647 | $18,240 | $3,950 | $14,290 |
| 2018 | $1,594 | $15,770 | $2,170 | $13,600 |
| 2017 | $1,586 | $15,770 | $2,170 | $13,600 |
| 2016 | $1,341 | $12,960 | $2,170 | $10,790 |
| 2015 | $1,349 | $12,960 | $2,170 | $10,790 |
| 2014 | $1,470 | $14,610 | $3,970 | $10,640 |
Source: Public Records
Map
Nearby Homes
- 2240 Brook Dr
- 505 Ridge Dr
- 2340 Saint Catherine St
- 2320 Allen Dr
- 12 Country Ln
- 785 Bobbins Ln
- 675 Pimlico Dr
- 2505 Saint Catherine St
- 1965 Saint Catherine St
- 765 Pimlico Dr
- 13 Bayberry Ln
- 750 Robinwood Dr
- 805 Derhake Rd
- 1040 Bluefield Dr
- 2020 Washington St Unit 707
- 2700 Suffolk Place
- 265 Waterford Dr
- 1060 Preakness Ln
- 1290 Saint Louis St
- 629 Aubuchon St
- 395 Ridge Dr
- 425 Ridge Dr
- 385 Ridge Dr
- 400 Saint Edward Ln
- 410 Saint Edward Ln
- 435 Ridge Dr
- 390 Saint Edward Ln
- 410 Ridge Dr
- 420 Saint Edward Ln
- 1 Country Ln
- 370 Saint Edward Ln
- 365 Ridge Dr
- 445 Ridge Dr
- 430 Saint Edward Ln
- 24 Country Ln
- 355 Ridge Dr
- 2 Country Ln
- 440 Saint Edward Ln
- 465 Ridge Dr
- 340 Saint Edward Ln