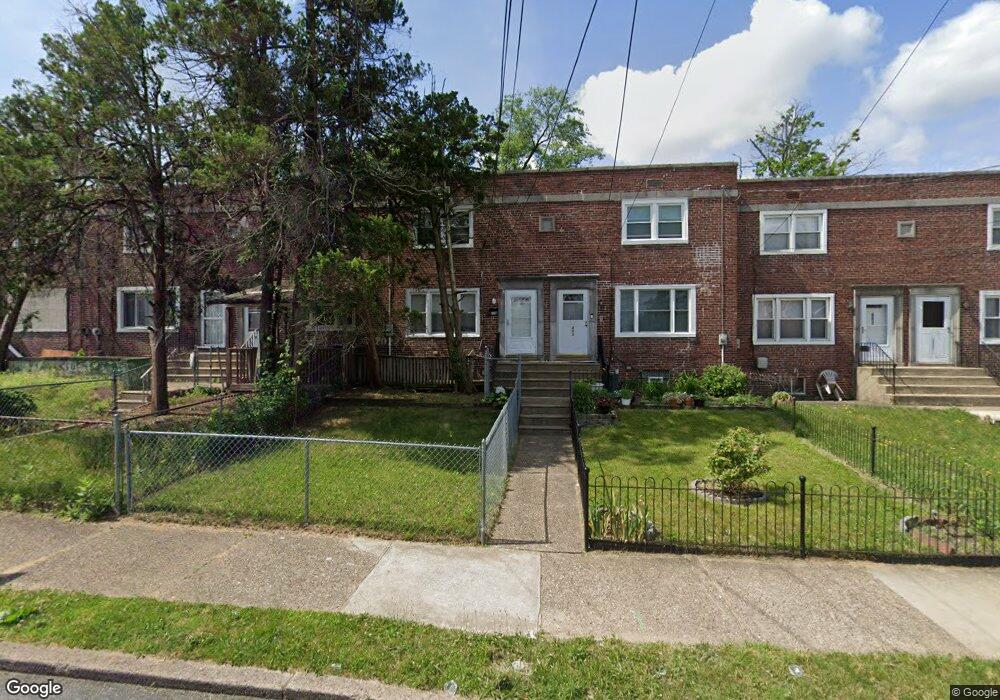
405 Royal Ave Camden, NJ 08105
Stockton NeighborhoodEstimated Value: $149,000 - $165,000
--
Bed
--
Bath
1,152
Sq Ft
$137/Sq Ft
Est. Value
About This Home
This home is located at 405 Royal Ave, Camden, NJ 08105 and is currently estimated at $157,984, approximately $137 per square foot. 405 Royal Ave is a home located in Camden County with nearby schools including Eastside High School, St Joseph Pro-Cathedral School, and Urban Promise Academy.
Ownership History
Date
Name
Owned For
Owner Type
Purchase Details
Closed on
Jul 31, 2006
Sold by
St Josephs Carpenter Society
Bought by
Surrency Tammy F
Current Estimated Value
Home Financials for this Owner
Home Financials are based on the most recent Mortgage that was taken out on this home.
Original Mortgage
$72,400
Outstanding Balance
$43,562
Interest Rate
6.8%
Estimated Equity
$114,422
Purchase Details
Closed on
Oct 25, 2005
Sold by
Butler Willie L
Bought by
St Josephs Carpenter Society
Create a Home Valuation Report for This Property
The Home Valuation Report is an in-depth analysis detailing your home's value as well as a comparison with similar homes in the area
Home Values in the Area
Average Home Value in this Area
Purchase History
| Date | Buyer | Sale Price | Title Company |
|---|---|---|---|
| Surrency Tammy F | $75,000 | -- | |
| St Josephs Carpenter Society | $50,000 | -- |
Source: Public Records
Mortgage History
| Date | Status | Borrower | Loan Amount |
|---|---|---|---|
| Open | Surrency Tammy F | $72,400 |
Source: Public Records
Tax History Compared to Growth
Tax History
| Year | Tax Paid | Tax Assessment Tax Assessment Total Assessment is a certain percentage of the fair market value that is determined by local assessors to be the total taxable value of land and additions on the property. | Land | Improvement |
|---|---|---|---|---|
| 2025 | $2,335 | $65,900 | $15,900 | $50,000 |
| 2024 | $2,257 | $65,900 | $15,900 | $50,000 |
| 2023 | $2,257 | $65,900 | $15,900 | $50,000 |
| 2022 | $2,215 | $65,900 | $15,900 | $50,000 |
| 2021 | $2,207 | $65,900 | $15,900 | $50,000 |
| 2020 | $2,096 | $65,900 | $15,900 | $50,000 |
| 2019 | $2,007 | $65,900 | $15,900 | $50,000 |
| 2018 | $1,996 | $65,900 | $15,900 | $50,000 |
| 2017 | $1,947 | $65,900 | $15,900 | $50,000 |
| 2016 | $1,885 | $65,900 | $15,900 | $50,000 |
| 2015 | $1,815 | $65,900 | $15,900 | $50,000 |
| 2014 | $1,771 | $65,900 | $15,900 | $50,000 |
Source: Public Records
Map
Nearby Homes
- 402 S 30th St
- 3001 Royden St
- 363 Garden Ave
- 2933 Royden St
- 520 Beacon Ave
- 355 S 27th St
- 6709 Chandler Ave
- 6861 Clark Ave
- 3075 Stevens St
- 226 Wilmot Ave
- 341 Marlton Ave
- 7130 Rosemont Ave
- 6887 Woodland Ave
- 420 Boyd St
- 154 Eutaw Ave
- 224 S 32nd St
- 3733 Drexel Ave
- 2937 Carman St
- 555 Pfeiffer St
- 113 S 32nd St