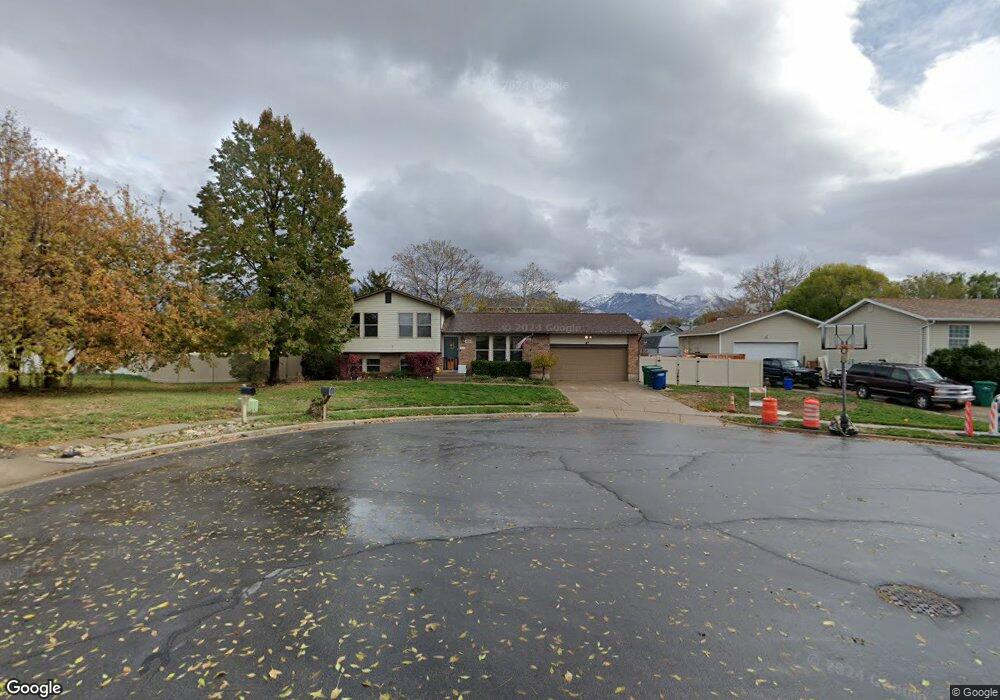
405 S 500 W Layton, UT 84041
Estimated Value: $423,000 - $458,000
3
Beds
2
Baths
1,010
Sq Ft
$430/Sq Ft
Est. Value
About This Home
This home is located at 405 S 500 W, Layton, UT 84041 and is currently estimated at $434,247, approximately $429 per square foot. 405 S 500 W is a home located in Davis County with nearby schools including Layton Elementary School, Fairfield Junior High School, and Layton High School.
Ownership History
Date
Name
Owned For
Owner Type
Purchase Details
Closed on
Feb 15, 2007
Sold by
Gardner Quin J and Gardner Camber I
Bought by
Beynon Josh C and Beynon Melanie B
Current Estimated Value
Home Financials for this Owner
Home Financials are based on the most recent Mortgage that was taken out on this home.
Original Mortgage
$34,600
Interest Rate
5.99%
Mortgage Type
Stand Alone Second
Purchase Details
Closed on
Jan 4, 2002
Sold by
Craig Jonathon H and Craig Dana M
Bought by
Gardner Quin J and Gardner Camber I
Home Financials for this Owner
Home Financials are based on the most recent Mortgage that was taken out on this home.
Original Mortgage
$106,400
Interest Rate
6.73%
Purchase Details
Closed on
May 26, 1998
Sold by
Howe David N
Bought by
Craig Jonathon H and Craig Dana M
Home Financials for this Owner
Home Financials are based on the most recent Mortgage that was taken out on this home.
Original Mortgage
$100,205
Interest Rate
7.13%
Mortgage Type
FHA
Create a Home Valuation Report for This Property
The Home Valuation Report is an in-depth analysis detailing your home's value as well as a comparison with similar homes in the area
Home Values in the Area
Average Home Value in this Area
Purchase History
| Date | Buyer | Sale Price | Title Company |
|---|---|---|---|
| Beynon Josh C | -- | Paramount Title Corp | |
| Gardner Quin J | -- | Security Title Company | |
| Craig Jonathon H | -- | Security Title |
Source: Public Records
Mortgage History
| Date | Status | Borrower | Loan Amount |
|---|---|---|---|
| Closed | Beynon Josh C | $34,600 | |
| Open | Beynon Josh C | $138,400 | |
| Previous Owner | Gardner Quin J | $106,400 | |
| Previous Owner | Craig Jonathon H | $100,205 |
Source: Public Records
Tax History Compared to Growth
Tax History
| Year | Tax Paid | Tax Assessment Tax Assessment Total Assessment is a certain percentage of the fair market value that is determined by local assessors to be the total taxable value of land and additions on the property. | Land | Improvement |
|---|---|---|---|---|
| 2024 | $2,049 | $216,700 | $136,544 | $80,156 |
| 2023 | $1,991 | $371,000 | $138,836 | $232,164 |
| 2022 | $2,157 | $218,350 | $84,315 | $134,035 |
| 2021 | $1,895 | $286,000 | $126,481 | $159,519 |
| 2020 | $1,699 | $246,000 | $107,067 | $138,933 |
| 2019 | $1,636 | $232,000 | $108,332 | $123,668 |
| 2018 | $1,489 | $212,000 | $95,183 | $116,817 |
| 2016 | $1,317 | $96,745 | $38,172 | $58,573 |
| 2015 | $1,277 | $89,045 | $38,172 | $50,873 |
| 2014 | $1,284 | $91,515 | $38,172 | $53,343 |
| 2013 | -- | $84,580 | $22,756 | $61,824 |
Source: Public Records
Map
Nearby Homes
- 267 S Melody St
- 562 S 850 W
- 750 W Gentile St
- 774 W Farming Way
- 933 W Gentile St
- 891 W 60 N
- 189 S Main St Unit 21
- 189 S Main St Unit 76
- 6 Grover St
- 302 E 900 S
- 282 E 925 S
- 1042 W Shoreline Dr
- 142 Green Dr
- 1071 Shoreline Dr
- 2060 W Phillips St
- 2056 W Phillips St
- 608 S Main St
- 526 King St Unit 2
- 444 Owens St
- 473 E Alice Way