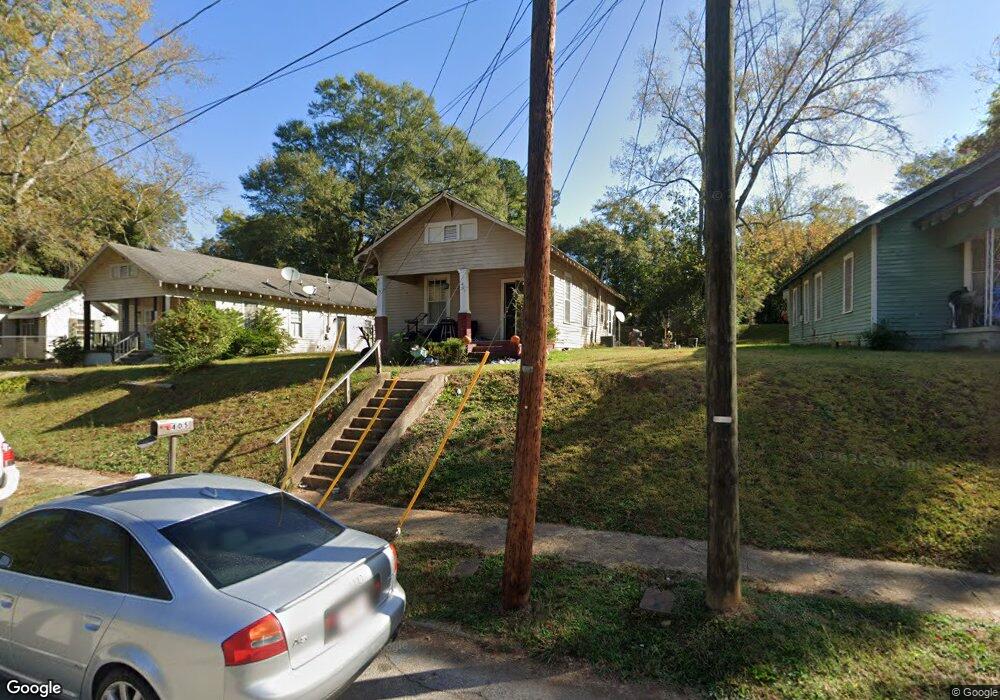
405 S Lee St Lagrange, GA 30240
Estimated Value: $86,000 - $113,000
3
Beds
1
Bath
1,058
Sq Ft
$97/Sq Ft
Est. Value
About This Home
This home is located at 405 S Lee St, Lagrange, GA 30240 and is currently estimated at $102,318, approximately $96 per square foot. 405 S Lee St is a home located in Troup County with nearby schools including Ethel W. Kight Elementary School, Hollis Hand Elementary School, and Franklin Forest Elementary School.
Ownership History
Date
Name
Owned For
Owner Type
Purchase Details
Closed on
Nov 30, 2021
Sold by
T Squared 1 Llc
Bought by
Brbrshy Investments Inc
Current Estimated Value
Purchase Details
Closed on
Jun 1, 2021
Sold by
Stribling Ty
Bought by
T Squared 1 Llc
Purchase Details
Closed on
Jul 18, 1996
Sold by
Arrington J R
Bought by
Stribling Ty
Purchase Details
Closed on
Feb 27, 1991
Sold by
Sessions David
Bought by
Arrington J R
Purchase Details
Closed on
May 10, 1990
Sold by
The Money Tree Inc
Bought by
Sessions David
Purchase Details
Closed on
May 9, 1990
Sold by
Avco Financial Services
Bought by
The Money Tree Inc
Purchase Details
Closed on
Apr 1, 1977
Sold by
Mathis James W and Fred Brown W
Bought by
Avco Financial Services
Purchase Details
Closed on
Dec 13, 1976
Sold by
Daniel A E
Bought by
Mathis James W and Fred Brown W
Purchase Details
Closed on
Nov 21, 1975
Sold by
Young James C and Young Edyth E
Bought by
Daniel A E
Purchase Details
Closed on
Nov 1, 1955
Sold by
Yates Cecil J
Bought by
Young James C and Young Edyth E
Create a Home Valuation Report for This Property
The Home Valuation Report is an in-depth analysis detailing your home's value as well as a comparison with similar homes in the area
Purchase History
| Date | Buyer | Sale Price | Title Company |
|---|---|---|---|
| Brbrshy Investments Inc | $12,484,500 | -- | |
| T Squared 1 Llc | -- | -- | |
| Stribling Ty | $12,200 | -- | |
| Arrington J R | $13,400 | -- | |
| Sessions David | -- | -- | |
| The Money Tree Inc | -- | -- | |
| Avco Financial Services | $9,000 | -- | |
| Mathis James W | $5,600 | -- | |
| Daniel A E | $5,100 | -- | |
| Young James C | -- | -- |
Source: Public Records
Tax History
| Year | Tax Paid | Tax Assessment Tax Assessment Total Assessment is a certain percentage of the fair market value that is determined by local assessors to be the total taxable value of land and additions on the property. | Land | Improvement |
|---|---|---|---|---|
| 2025 | $721 | $26,440 | $2,760 | $23,680 |
| 2024 | $695 | $25,480 | $2,760 | $22,720 |
| 2023 | $411 | $15,080 | $2,760 | $12,320 |
| 2022 | $397 | $14,240 | $2,760 | $11,480 |
| 2021 | $218 | $7,240 | $2,760 | $4,480 |
| 2020 | $218 | $7,240 | $2,760 | $4,480 |
| 2019 | $197 | $6,520 | $2,200 | $4,320 |
| 2018 | $190 | $6,308 | $1,988 | $4,320 |
| 2017 | $190 | $6,308 | $1,988 | $4,320 |
| 2016 | $205 | $6,810 | $1,988 | $4,822 |
| 2015 | $208 | $6,896 | $2,073 | $4,822 |
| 2014 | $209 | $6,896 | $2,073 | $4,822 |
| 2013 | -- | $9,418 | $2,764 | $6,654 |
Source: Public Records
Map
Nearby Homes
- 0 N Lee St Unit 10550825
- 217 Jefferson St
- 507 S Lee St
- 211 Moores Hill
- 0 Moores Hill
- 517 Jefferson St
- 107 Clark St
- 202 Parker Ln
- 109 Garfield St
- 421 College Ave
- 403 College Ave
- 416 Park Ave
- 119 College Ave
- 600 Park Ave
- 1520 Brownwood Ave
- 812 Elm St
- 304 Boulevard
- 208 Boulevard
- 207 Wilkes St
- 1304 Forrest Ave
Your Personal Tour Guide
Ask me questions while you tour the home.