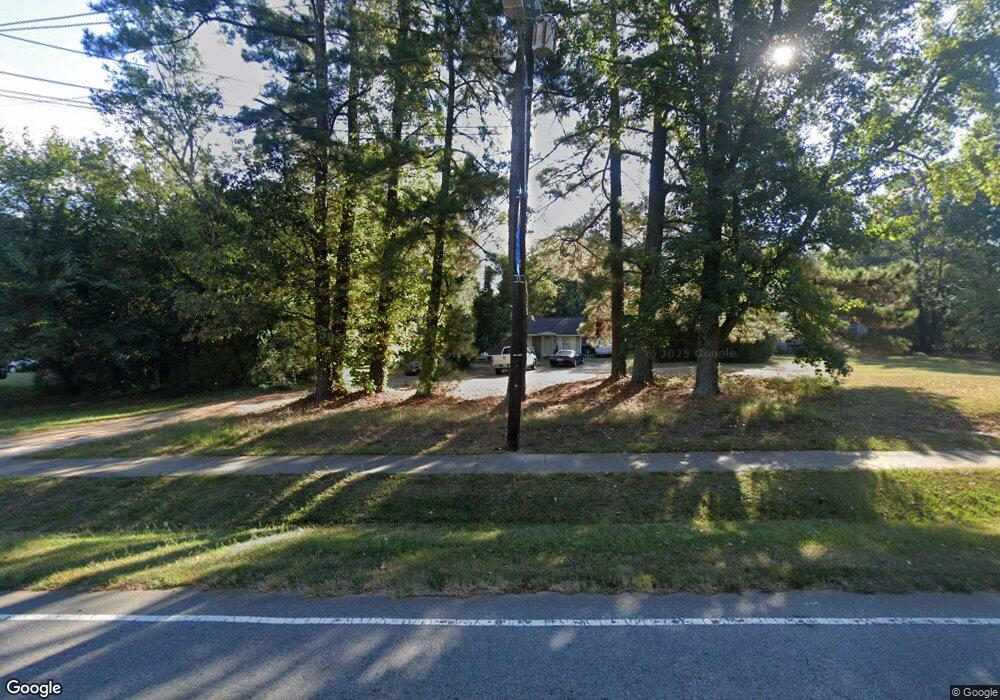
405 S Main St Holly Springs, NC 27540
Estimated Value: $336,000 - $436,819
--
Bed
3
Baths
1,248
Sq Ft
$310/Sq Ft
Est. Value
About This Home
This home is located at 405 S Main St, Holly Springs, NC 27540 and is currently estimated at $386,455, approximately $309 per square foot. 405 S Main St is a home located in Wake County with nearby schools including Holly Springs Elementary School, Holly Ridge Middle School, and Holly Springs High School.
Ownership History
Date
Name
Owned For
Owner Type
Purchase Details
Closed on
Apr 26, 2022
Sold by
Lynette Womble Crystal and Lynette Gregory J
Bought by
Fusion Investments Llc
Current Estimated Value
Purchase Details
Closed on
Sep 21, 2006
Sold by
Grigsby George T
Bought by
Womble Crystal Lynette
Purchase Details
Closed on
Feb 27, 2006
Sold by
Womble Parrish L and Womble Nancy H
Bought by
Womble Crystal Lynette
Create a Home Valuation Report for This Property
The Home Valuation Report is an in-depth analysis detailing your home's value as well as a comparison with similar homes in the area
Home Values in the Area
Average Home Value in this Area
Purchase History
| Date | Buyer | Sale Price | Title Company |
|---|---|---|---|
| Fusion Investments Llc | $850 | James S Adcock Iii Pa | |
| Womble Crystal Lynette | -- | None Available | |
| Womble Crystal Lynette | -- | None Available |
Source: Public Records
Tax History Compared to Growth
Tax History
| Year | Tax Paid | Tax Assessment Tax Assessment Total Assessment is a certain percentage of the fair market value that is determined by local assessors to be the total taxable value of land and additions on the property. | Land | Improvement |
|---|---|---|---|---|
| 2025 | $2,478 | $285,561 | $117,000 | $168,561 |
| 2024 | $2,467 | $285,561 | $117,000 | $168,561 |
| 2023 | $1,534 | $140,389 | $49,400 | $90,989 |
| 2022 | $1,482 | $140,389 | $49,400 | $90,989 |
| 2021 | $1,454 | $140,389 | $49,400 | $90,989 |
| 2020 | $1,454 | $140,389 | $49,400 | $90,989 |
| 2019 | $1,360 | $111,386 | $42,000 | $69,386 |
| 2018 | $1,231 | $111,386 | $42,000 | $69,386 |
| 2017 | $1,187 | $111,386 | $42,000 | $69,386 |
| 2016 | $1,171 | $111,386 | $42,000 | $69,386 |
| 2015 | $1,117 | $104,522 | $42,000 | $62,522 |
| 2014 | $1,079 | $104,522 | $42,000 | $62,522 |
Source: Public Records
Map
Nearby Homes
- 421 Grigsby Ave
- 220 Avent Ferry Rd
- 717 Utley St
- 401 Vista Springs Cir
- 308 E Maple Ave
- 104 Chilmark Ridge Dr
- 4014 Kentworth Dr
- 105 Cross Hill Ln
- 321 Cross Hill Ln
- 112 Burt St
- 144 Holly Mountain Rd
- 124 Cliffdale Rd
- 225 Douglas St
- 321 Blalock St
- 2027 Hayes Ln
- 109 Lacombe Ct
- 224 Hartshorn Ct
- 137 Lacombe Ct
- 141 Spring Pine Ln
- 705 Morton Farm Rd
- 422 S Main St
- 100 Oak Ave
- 00 Oak Ave
- 000 Oak Ave
- 408 Grigsby Ave
- 424 Grigsby Ave
- 424 Grigisby
- 419 Grigsby Ave
- 399 Grigsby Ave
- 108 W Elm Ave
- 101 E Oak St
- 503 Grigsby Ave
- 513 S Main St
- 301 Grigsby Ave
- 301 Grigsby Ave Unit B
- 301 Grigsby Ave Unit A
- 412 Grigsby Ave
- 301 - A/B Grigisby
- 301 Grigisby Dr
- 600 S Main St