Studio
--
Bath
19,500
Sq Ft
28,314
Sq Ft Lot
About This Home
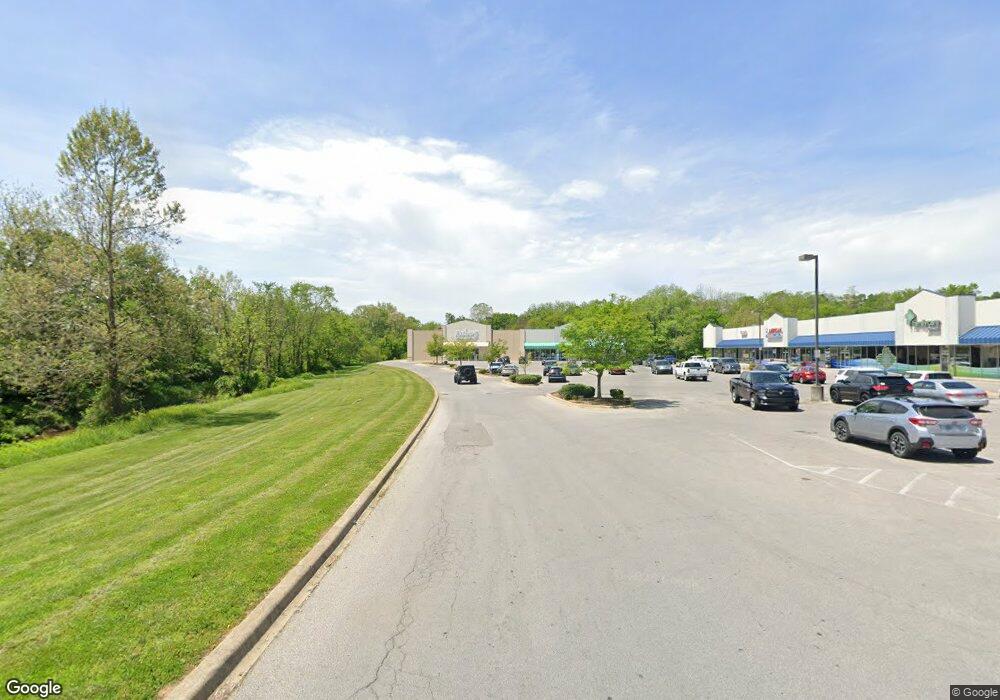
This home is located at 405 S Main St, Salem, IN 47167. 405 S Main St is a home located in Washington County with nearby schools including Bradie M. Shrum Lower Elementary School, Salem Middle School, and Salem High School.
Ownership History
Date
Name
Owned For
Owner Type
Purchase Details
Closed on
Jan 11, 2017
Sold by
Michael Daniel
Bought by
Evan Kohanian
Home Financials for this Owner
Home Financials are based on the most recent Mortgage that was taken out on this home.
Original Mortgage
$2,400,000
Outstanding Balance
$263,781
Interest Rate
4.16%
Mortgage Type
Commercial
Purchase Details
Closed on
Aug 11, 2016
Sold by
Bryan Jennifer
Bought by
Daniel J Michael
Purchase Details
Closed on
Feb 25, 2016
Sold by
Kentuckiana Real Estate Holdings Llc
Bought by
Eig Salem Llc
Purchase Details
Closed on
Mar 12, 2015
Sold by
Your Community Bank
Bought by
Kentuckiana Real Estate Holdings Llc
Purchase Details
Closed on
Mar 6, 2015
Sold by
Melas Llc
Bought by
Your Community Bank
Create a Home Valuation Report for This Property
The Home Valuation Report is an in-depth analysis detailing your home's value as well as a comparison with similar homes in the area
Home Values in the Area
Average Home Value in this Area
Purchase History
| Date | Buyer | Sale Price | Title Company |
|---|---|---|---|
| Evan Kohanian | $3,000,000 | -- | |
| Salem Shopping Centerl Llc | -- | None Available | |
| Daniel J Michael | $23,600 | -- | |
| Eig Salem Llc | -- | None Available | |
| Eig Salem Llc | -- | None Available | |
| Kentuckiana Real Estate Holdings Llc | -- | None Available | |
| Your Community Bank | -- | None Available |
Source: Public Records
Mortgage History
| Date | Status | Borrower | Loan Amount |
|---|---|---|---|
| Open | Salem Shopping Centerl Llc | $2,400,000 |
Source: Public Records
Tax History
| Year | Tax Paid | Tax Assessment Tax Assessment Total Assessment is a certain percentage of the fair market value that is determined by local assessors to be the total taxable value of land and additions on the property. | Land | Improvement |
|---|---|---|---|---|
| 2025 | $55,215 | $2,260,200 | $491,400 | $1,768,800 |
| 2024 | $55,215 | $2,024,700 | $491,400 | $1,533,300 |
| 2023 | $55,230 | $2,112,000 | $491,400 | $1,620,600 |
| 2022 | $63,900 | $2,130,000 | $491,400 | $1,638,600 |
| 2021 | $61,065 | $2,035,500 | $491,400 | $1,544,100 |
| 2020 | $62,505 | $2,083,500 | $491,400 | $1,592,100 |
| 2019 | $62,505 | $2,083,500 | $491,400 | $1,592,100 |
| 2018 | $63,960 | $2,132,000 | $491,400 | $1,640,600 |
| 2017 | $62,250 | $2,163,400 | $491,400 | $1,672,000 |
| 2016 | $57,583 | $2,144,800 | $491,400 | $1,653,400 |
| 2014 | $62,005 | $2,903,200 | $961,400 | $1,941,800 |
| 2013 | $40,648 | $2,696,100 | $961,400 | $1,734,700 |
Source: Public Records
Map
Nearby Homes
- 701 S Main St
- 301 E Market St
- 104 Hounds Way
- 803 W Market St
- 412 Ridgeview Dr
- 11 Campbell Ct
- 208 Highland Dr
- 409 N Water St
- 115 Lincoln St
- 114 Lincoln St
- 201 Marshall Ave
- 509 N High St
- 604 N Main St
- 115 Nichols Ave
- 218 Washington Blvd
- 607 Berkey St
- 606 Berkey St
- 901 N College Ave
- 702 W Becks Mill Rd
- 905 Locust St
Your Personal Tour Guide
Ask me questions while you tour the home.