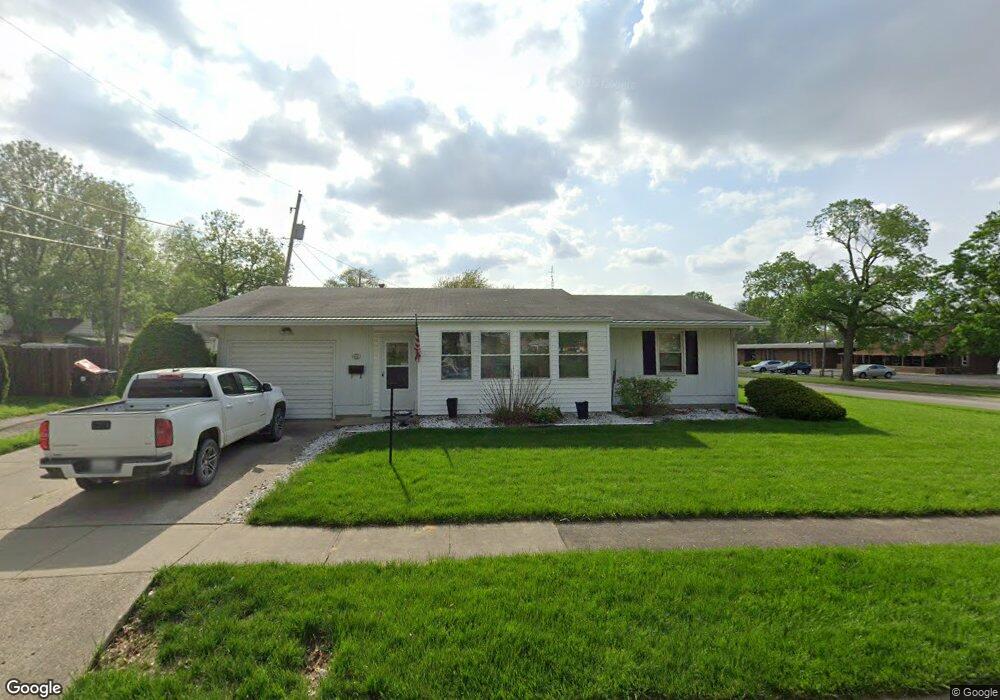
405 S Maple St Lincoln, IL 62656
Estimated Value: $116,000 - $145,000
Studio
--
Bath
1,192
Sq Ft
$113/Sq Ft
Est. Value
About This Home
This home is located at 405 S Maple St, Lincoln, IL 62656 and is currently estimated at $134,458, approximately $112 per square foot. 405 S Maple St is a home located in Logan County with nearby schools including Central Elementary School, Lincoln Junior High School, and Lincoln Community High School.
Ownership History
Date
Name
Owned For
Owner Type
Purchase Details
Closed on
Nov 23, 2024
Sold by
Kvitle Barbara A and Verban Emil M
Bought by
Young Verban
Current Estimated Value
Home Financials for this Owner
Home Financials are based on the most recent Mortgage that was taken out on this home.
Original Mortgage
$99,000
Outstanding Balance
$98,090
Interest Rate
6.54%
Mortgage Type
New Conventional
Estimated Equity
$36,368
Purchase Details
Closed on
Sep 15, 1991
Bought by
Verban Steve J
Create a Home Valuation Report for This Property
The Home Valuation Report is an in-depth analysis detailing your home's value as well as a comparison with similar homes in the area
Home Values in the Area
Average Home Value in this Area
Purchase History
| Date | Buyer | Sale Price | Title Company |
|---|---|---|---|
| Young Verban | $110,000 | None Available | |
| Verban Steve J | $57,000 | -- |
Source: Public Records
Mortgage History
| Date | Status | Borrower | Loan Amount |
|---|---|---|---|
| Open | Young Verban | $99,000 |
Source: Public Records
Tax History
| Year | Tax Paid | Tax Assessment Tax Assessment Total Assessment is a certain percentage of the fair market value that is determined by local assessors to be the total taxable value of land and additions on the property. | Land | Improvement |
|---|---|---|---|---|
| 2024 | $2,321 | $36,660 | $8,820 | $27,840 |
| 2023 | $2,140 | $33,950 | $8,170 | $25,780 |
| 2022 | $1,532 | $31,660 | $7,620 | $24,040 |
| 2021 | $1,537 | $30,490 | $7,340 | $23,150 |
| 2020 | $1,540 | $30,490 | $7,340 | $23,150 |
| 2019 | $1,650 | $29,900 | $7,200 | $22,700 |
| 2018 | $2,249 | $28,750 | $6,920 | $21,830 |
| 2017 | $2,237 | $28,750 | $6,920 | $21,830 |
| 2016 | $2,215 | $29,090 | $7,000 | $22,090 |
| 2015 | $2,005 | $27,840 | $6,740 | $21,100 |
| 2014 | $2,005 | $27,840 | $6,740 | $21,100 |
| 2013 | $2,005 | $25,690 | $6,220 | $19,470 |
| 2012 | $2,005 | $26,060 | $6,310 | $19,750 |
Source: Public Records
Map
Nearby Homes
Your Personal Tour Guide
Ask me questions while you tour the home.