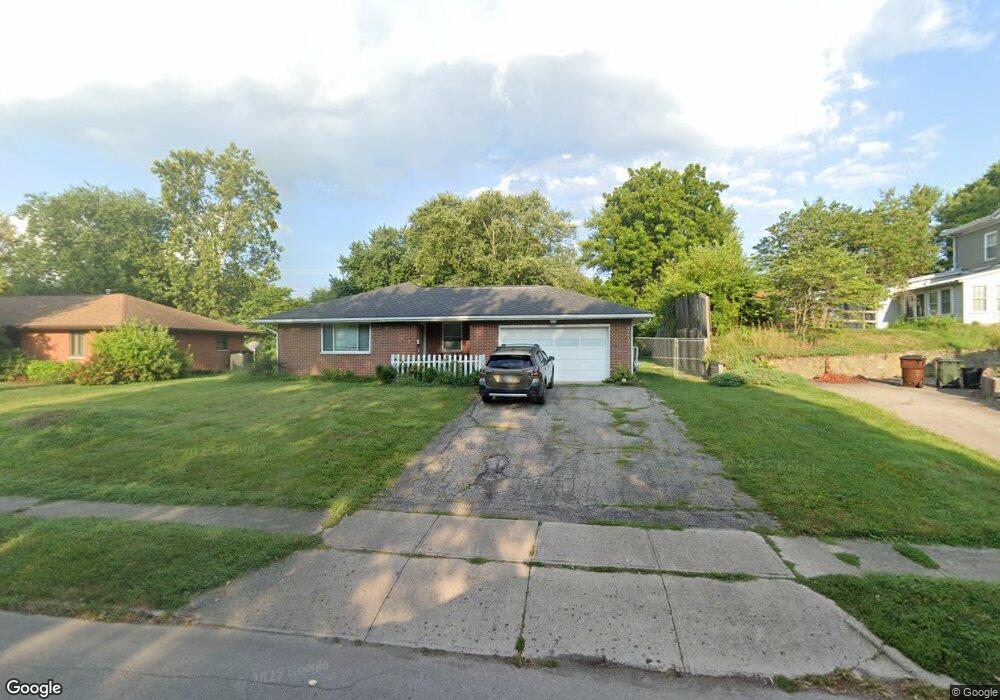
405 S Walnut St Englewood, OH 45322
Estimated Value: $181,000 - $204,000
3
Beds
2
Baths
1,268
Sq Ft
$154/Sq Ft
Est. Value
About This Home
This home is located at 405 S Walnut St, Englewood, OH 45322 and is currently estimated at $195,598, approximately $154 per square foot. 405 S Walnut St is a home located in Montgomery County with nearby schools including Northmont High School, Trotwood Preparatory & Fitness Academy, and Salem Christian Academy.
Ownership History
Date
Name
Owned For
Owner Type
Purchase Details
Closed on
Nov 7, 2018
Sold by
Baden Jared A
Bought by
Chakeres Kirstie M and Richardson Chris M
Current Estimated Value
Home Financials for this Owner
Home Financials are based on the most recent Mortgage that was taken out on this home.
Original Mortgage
$91,920
Outstanding Balance
$80,660
Interest Rate
4.7%
Mortgage Type
Purchase Money Mortgage
Estimated Equity
$114,938
Purchase Details
Closed on
Jul 2, 2014
Sold by
Fannie Mae
Bought by
Baden Jared A
Home Financials for this Owner
Home Financials are based on the most recent Mortgage that was taken out on this home.
Original Mortgage
$55,955
Interest Rate
4.11%
Mortgage Type
Future Advance Clause Open End Mortgage
Purchase Details
Closed on
Mar 29, 2012
Sold by
Miller Christopher E
Bought by
Miller Tiffarg D and Miller Ishen
Create a Home Valuation Report for This Property
The Home Valuation Report is an in-depth analysis detailing your home's value as well as a comparison with similar homes in the area
Home Values in the Area
Average Home Value in this Area
Purchase History
| Date | Buyer | Sale Price | Title Company |
|---|---|---|---|
| Chakeres Kirstie M | $114,900 | Sterling Land Title Agency I | |
| Baden Jared A | -- | Allodial Title Llc | |
| Miller Tiffarg D | -- | None Available |
Source: Public Records
Mortgage History
| Date | Status | Borrower | Loan Amount |
|---|---|---|---|
| Open | Chakeres Kirstie M | $91,920 | |
| Previous Owner | Baden Jared A | $55,955 |
Source: Public Records
Tax History Compared to Growth
Tax History
| Year | Tax Paid | Tax Assessment Tax Assessment Total Assessment is a certain percentage of the fair market value that is determined by local assessors to be the total taxable value of land and additions on the property. | Land | Improvement |
|---|---|---|---|---|
| 2024 | $3,140 | $54,980 | $10,580 | $44,400 |
| 2023 | $3,140 | $54,980 | $10,580 | $44,400 |
| 2022 | $2,869 | $38,660 | $7,450 | $31,210 |
| 2021 | $2,877 | $38,660 | $7,450 | $31,210 |
| 2020 | $2,822 | $38,660 | $7,450 | $31,210 |
| 2019 | $2,592 | $31,810 | $8,570 | $23,240 |
| 2018 | $2,545 | $31,810 | $8,570 | $23,240 |
| 2017 | $2,527 | $31,810 | $8,570 | $23,240 |
| 2016 | $2,462 | $30,420 | $7,450 | $22,970 |
| 2015 | $2,312 | $30,420 | $7,450 | $22,970 |
| 2014 | $2,312 | $30,420 | $7,450 | $22,970 |
| 2012 | -- | $34,840 | $8,260 | $26,580 |
Source: Public Records
Map
Nearby Homes
- 108 Tate Ave
- 607 Albert St
- 109 Silverstone Dr
- 104 Silverstone Dr
- 123 Chestnut St
- 206 Lodestone Dr
- 803 Albert St
- 800 Sipos Cir
- 510 Rohr Ln
- 118 Elm Ct
- 534 Unger Ave
- 320 Camborne Dr
- 408 W Herr St
- 717 Woodlawn Ave
- 332 Beckenham Rd
- 108 Denwood Trail
- 510 Lambert Ln
- 718 Bonnycastle Ave
- 306 Pauly Dr
- 322 Rankin Dr