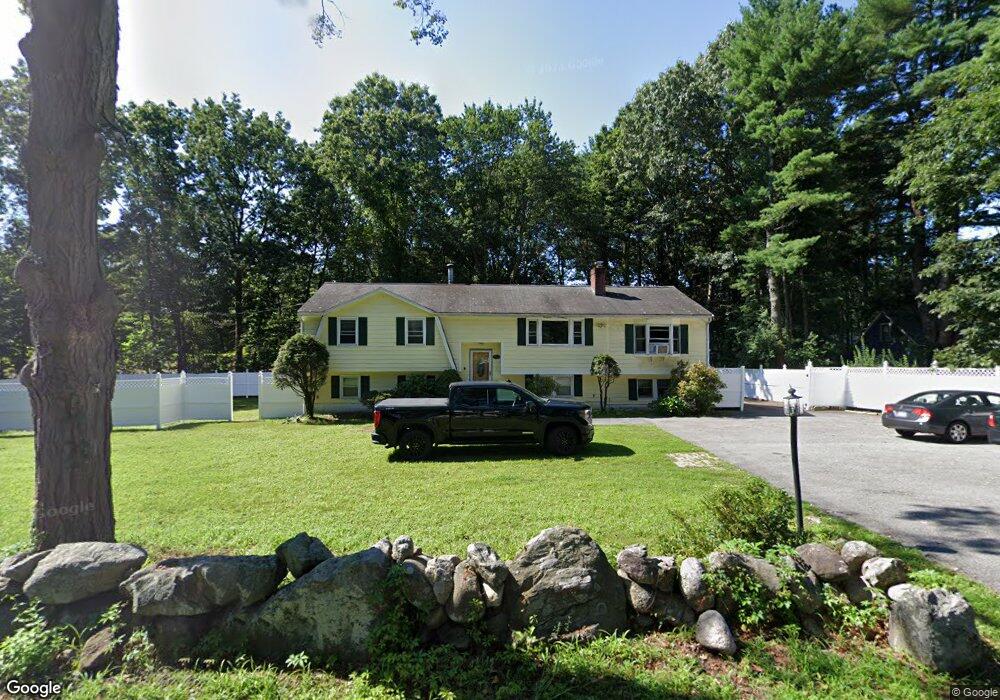
405 Salem St Wilmington, MA 01887
Estimated Value: $724,000 - $870,000
3
Beds
3
Baths
1,522
Sq Ft
$527/Sq Ft
Est. Value
About This Home
This home is located at 405 Salem St, Wilmington, MA 01887 and is currently estimated at $802,376, approximately $527 per square foot. 405 Salem St is a home located in Middlesex County with nearby schools including Wilmington Middle School, Wilmington High School, and Abundant Life Christian School and Childcare.
Ownership History
Date
Name
Owned For
Owner Type
Purchase Details
Closed on
Jul 1, 2004
Sold by
Fincl Cendant Mobility
Bought by
Mcnamara Richard
Current Estimated Value
Purchase Details
Closed on
Oct 4, 2000
Sold by
Cabral Michael S and Cabral Deborah A
Bought by
Arbogast Mark S
Purchase Details
Closed on
Jun 25, 1993
Sold by
Leavitt Kenneth M and Leavitt Donna J
Bought by
Cabral Michael S
Create a Home Valuation Report for This Property
The Home Valuation Report is an in-depth analysis detailing your home's value as well as a comparison with similar homes in the area
Home Values in the Area
Average Home Value in this Area
Purchase History
| Date | Buyer | Sale Price | Title Company |
|---|---|---|---|
| Mcnamara Richard | $447,000 | -- | |
| Cendant Mobilit Fncl C | $447,000 | -- | |
| Arbogast Mark S | $376,000 | -- | |
| Cabral Michael S | $167,500 | -- |
Source: Public Records
Mortgage History
| Date | Status | Borrower | Loan Amount |
|---|---|---|---|
| Open | Cabral Michael S | $336,000 | |
| Closed | Cabral Michael S | $340,000 |
Source: Public Records
Tax History Compared to Growth
Tax History
| Year | Tax Paid | Tax Assessment Tax Assessment Total Assessment is a certain percentage of the fair market value that is determined by local assessors to be the total taxable value of land and additions on the property. | Land | Improvement |
|---|---|---|---|---|
| 2025 | $8,037 | $701,900 | $262,700 | $439,200 |
| 2024 | $7,954 | $695,900 | $262,700 | $433,200 |
| 2023 | $7,828 | $655,600 | $238,800 | $416,800 |
| 2022 | $7,517 | $576,900 | $198,900 | $378,000 |
| 2021 | $7,463 | $539,200 | $180,800 | $358,400 |
| 2020 | $7,715 | $568,100 | $180,800 | $387,300 |
| 2019 | $7,124 | $518,100 | $172,300 | $345,800 |
| 2018 | $6,662 | $462,300 | $164,000 | $298,300 |
| 2017 | $6,520 | $451,200 | $164,000 | $287,200 |
| 2016 | $6,165 | $421,400 | $156,300 | $265,100 |
| 2015 | $5,833 | $405,900 | $156,300 | $249,600 |
| 2014 | $5,485 | $385,200 | $148,900 | $236,300 |
Source: Public Records
Map
Nearby Homes
- 12 Lockwood Rd
- 1 Evans Dr
- 220 Martins Landing Unit 309
- 3 Oakdale Rd
- 260 Martins Landing Unit 508
- 260 Martins Landing Unit 103
- 300 Martins Landing Unit 107
- 320 Martins Landing Unit 108
- 320 Martins Landing Unit 109
- 320 Martins Landing Unit 110
- 320 Martins Landing Unit 303
- 320 Martins Landing Unit 102
- 320 Martins Landing Unit 103
- 320 Martins Landing Unit 2410
- 320 Martins Landing Unit 403
- 320 Martins Landing Unit 2201
- 320 Martins Landing Unit 112
- 320 Martins Landing Unit 206
- 320 Martins Landing Unit 2307
- 320 Martins Landing Unit 302