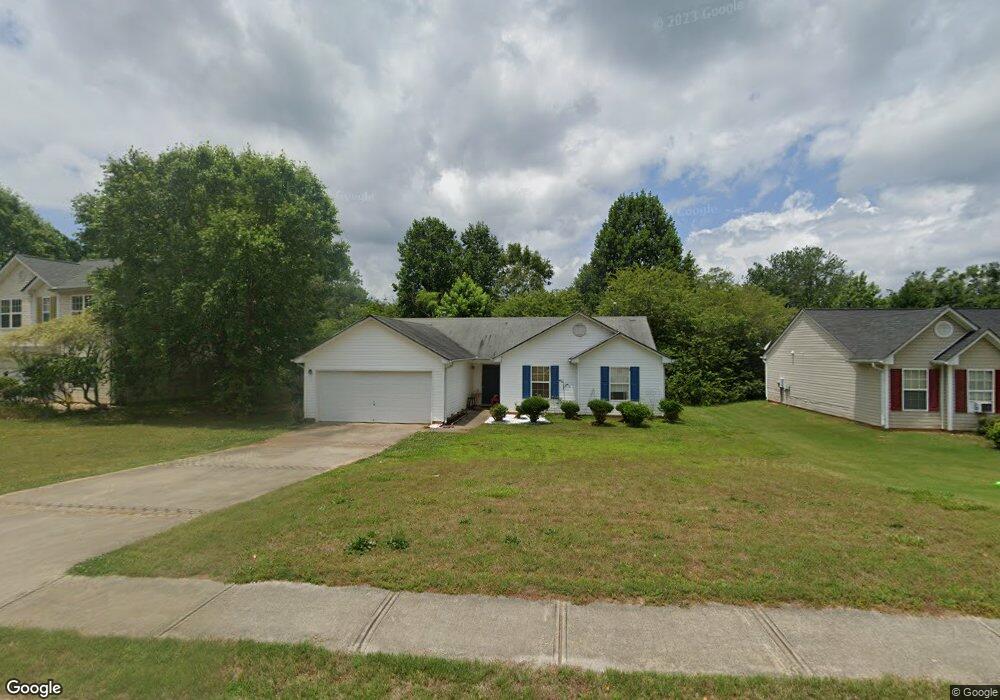
405 Shenandoah Ct Unit 3 Winder, GA 30680
Estimated Value: $290,000 - $307,000
3
Beds
2
Baths
1,275
Sq Ft
$235/Sq Ft
Est. Value
About This Home
This home is located at 405 Shenandoah Ct Unit 3, Winder, GA 30680 and is currently estimated at $299,954, approximately $235 per square foot. 405 Shenandoah Ct Unit 3 is a home located in Barrow County with nearby schools including County Line Elementary School, Russell Middle School, and Winder-Barrow High School.
Ownership History
Date
Name
Owned For
Owner Type
Purchase Details
Closed on
May 27, 2010
Sold by
Homesales Inc
Bought by
Hester Charles K
Current Estimated Value
Home Financials for this Owner
Home Financials are based on the most recent Mortgage that was taken out on this home.
Original Mortgage
$86,734
Outstanding Balance
$57,992
Interest Rate
5%
Mortgage Type
New Conventional
Estimated Equity
$241,962
Purchase Details
Closed on
Dec 1, 2009
Sold by
Wood Daniel J and Wood Shannon E
Bought by
Homesales Inc
Purchase Details
Closed on
Nov 10, 2003
Sold by
Tri-G Prop Inc
Bought by
Wood Daniel J and Wood Shannon
Home Financials for this Owner
Home Financials are based on the most recent Mortgage that was taken out on this home.
Original Mortgage
$104,000
Interest Rate
5.75%
Mortgage Type
New Conventional
Purchase Details
Closed on
Nov 13, 2002
Sold by
Shenandoah Partners
Bought by
Tri-G Properties Inc
Purchase Details
Closed on
Jul 22, 2002
Bought by
Shenandoah Partners
Create a Home Valuation Report for This Property
The Home Valuation Report is an in-depth analysis detailing your home's value as well as a comparison with similar homes in the area
Home Values in the Area
Average Home Value in this Area
Purchase History
| Date | Buyer | Sale Price | Title Company |
|---|---|---|---|
| Hester Charles K | $83,300 | -- | |
| Homesales Inc | $78,722 | -- | |
| Wood Daniel J | $104,000 | -- | |
| Tri-G Properties Inc | $137,500 | -- | |
| Shenandoah Partners | -- | -- |
Source: Public Records
Mortgage History
| Date | Status | Borrower | Loan Amount |
|---|---|---|---|
| Open | Hester Charles K | $86,734 | |
| Previous Owner | Wood Daniel J | $104,000 |
Source: Public Records
Tax History Compared to Growth
Tax History
| Year | Tax Paid | Tax Assessment Tax Assessment Total Assessment is a certain percentage of the fair market value that is determined by local assessors to be the total taxable value of land and additions on the property. | Land | Improvement |
|---|---|---|---|---|
| 2024 | $2,741 | $96,706 | $23,200 | $73,506 |
| 2023 | $2,474 | $87,383 | $22,000 | $65,383 |
| 2022 | $2,473 | $72,157 | $16,000 | $56,157 |
| 2021 | $2,125 | $57,766 | $14,000 | $43,766 |
| 2020 | $1,860 | $52,669 | $12,000 | $40,669 |
| 2019 | $1,885 | $52,669 | $12,000 | $40,669 |
| 2018 | $1,657 | $45,882 | $10,000 | $35,882 |
| 2017 | $1,087 | $36,420 | $10,000 | $26,420 |
| 2016 | $1,184 | $34,323 | $10,000 | $24,323 |
| 2015 | $1,194 | $34,592 | $10,000 | $24,592 |
| 2014 | $1,079 | $30,937 | $6,076 | $24,861 |
| 2013 | -- | $29,724 | $6,076 | $23,648 |
Source: Public Records
Map
Nearby Homes
- 405 Shenandoah Ct
- 403 Shenandoah Ct
- 407 Shenandoah Ct
- 411 Shenandoah Ct Unit 3
- 341 Shenandoah Cir Unit 3
- 343 Shenandoah Cir Unit 3
- 339 Shenandoah Cir
- 339 Shenandoah Cir Unit 3
- 413 Shenandoah Ct
- 525 Shenandoah Ln Unit 2
- 404 Shenandoah Ct Unit 17
- 404 Shenandoah Ct Unit 3
- 527 Shenandoah Ln Unit 2
- 347 Shenandoah Cir Unit 3
- 347 Shenandoah Cir
- 523 Shenandoah Ln Unit 2
- 402 Shenandoah Ct
- 402 Shenandoah Ct Unit 3
- 406 Shenandoah Ct
- 529 Shenandoah Ln