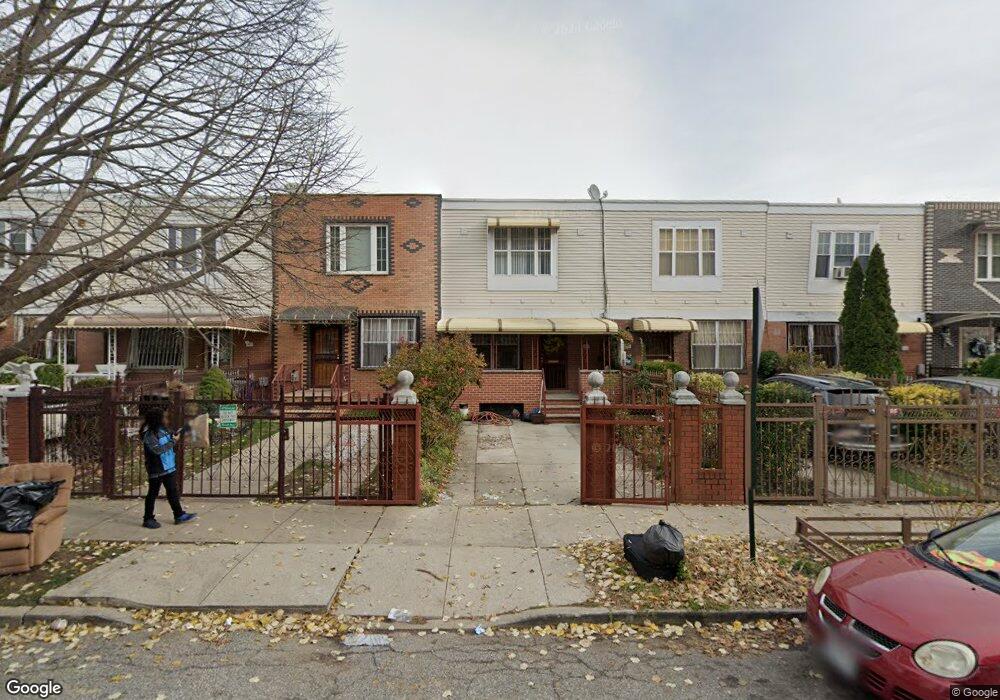
405 Snediker Ave Brooklyn, NY 11207
Brownsville NeighborhoodEstimated Value: $570,241 - $701,000
--
Bed
--
Bath
1,332
Sq Ft
$480/Sq Ft
Est. Value
About This Home
This home is located at 405 Snediker Ave, Brooklyn, NY 11207 and is currently estimated at $639,060, approximately $479 per square foot. 405 Snediker Ave is a home located in Kings County with nearby schools including Brooklyn Gardens Elementary School, J.H.S 292 Margaret S. Douglas, and Hyde Leadership Charter School-Brooklyn.
Ownership History
Date
Name
Owned For
Owner Type
Purchase Details
Closed on
Nov 7, 2024
Sold by
Bullock Jr. George and Bullock Sr. George
Bought by
Bullock Sr. George
Current Estimated Value
Purchase Details
Closed on
Jan 25, 2023
Sold by
Bullock George
Bought by
Bullock George and Bullock George
Purchase Details
Closed on
Jun 15, 2020
Sold by
Bullock Kim
Bought by
Bullock George and Bullock Kim
Home Financials for this Owner
Home Financials are based on the most recent Mortgage that was taken out on this home.
Original Mortgage
$11,196
Outstanding Balance
$9,906
Interest Rate
3.1%
Mortgage Type
New Conventional
Estimated Equity
$629,154
Purchase Details
Closed on
Nov 21, 1997
Sold by
Nehemiah Housing Development Fund Co Inc
Bought by
Bullock Kim
Home Financials for this Owner
Home Financials are based on the most recent Mortgage that was taken out on this home.
Original Mortgage
$68,000
Interest Rate
7.11%
Create a Home Valuation Report for This Property
The Home Valuation Report is an in-depth analysis detailing your home's value as well as a comparison with similar homes in the area
Home Values in the Area
Average Home Value in this Area
Purchase History
| Date | Buyer | Sale Price | Title Company |
|---|---|---|---|
| Bullock Sr. George | -- | -- | |
| Bullock George | -- | -- | |
| Bullock George | -- | -- | |
| Bullock George | -- | -- | |
| Bullock George | -- | -- | |
| Bullock Kim | $93,000 | -- | |
| Bullock Kim | $93,000 | -- |
Source: Public Records
Mortgage History
| Date | Status | Borrower | Loan Amount |
|---|---|---|---|
| Open | Bullock George | $11,196 | |
| Closed | Bullock George | $11,196 | |
| Previous Owner | Bullock Kim | $68,000 | |
| Closed | Bullock Kim | $20,000 |
Source: Public Records
Tax History Compared to Growth
Tax History
| Year | Tax Paid | Tax Assessment Tax Assessment Total Assessment is a certain percentage of the fair market value that is determined by local assessors to be the total taxable value of land and additions on the property. | Land | Improvement |
|---|---|---|---|---|
| 2025 | $4,717 | $37,080 | $10,380 | $26,700 |
| 2024 | $4,717 | $39,780 | $10,380 | $29,400 |
| 2023 | $4,581 | $36,360 | $10,380 | $25,980 |
| 2022 | $4,456 | $32,040 | $10,380 | $21,660 |
| 2021 | $4,462 | $29,520 | $10,380 | $19,140 |
| 2020 | $3,346 | $24,960 | $10,380 | $14,580 |
| 2019 | $4,045 | $24,960 | $10,380 | $14,580 |
| 2018 | $3,772 | $19,963 | $10,069 | $9,894 |
| 2017 | $3,490 | $19,800 | $7,698 | $12,102 |
| 2016 | $2,973 | $18,840 | $6,738 | $12,102 |
| 2015 | $1,060 | $18,109 | $6,007 | $12,102 |
| 2014 | $1,060 | $17,280 | $5,178 | $12,102 |
Source: Public Records
Map
Nearby Homes
- 406 Hinsdale St
- 440 Blake Ave
- 297 Hinsdale St
- 533 Snediker Ave
- 541 Hinsdale St
- 576 Williams Ave
- 578 Williams Ave
- 582 Williams Ave
- 442 Newport St
- 637 Blake Ave
- 546 Powell St
- 584 Hinsdale St
- 606 Alabama Ave
- 610 Alabama Ave
- 563 Powell St
- 589 Hinsdale St
- 699 Sackman St
- 353 Pennsylvania Ave
- 444 New Jersey Ave
- 486 Vermont St
- 407 Snediker Ave
- 403 Snediker Ave
- 401 Snediker Ave Unit 403
- 401-403 Snediker Ave
- 409 Snediker Ave
- 399 Snediker Ave
- 411 Snediker Ave
- 397 Snediker Ave
- 413 Snediker Ave
- 395 Snediker Ave
- 415 Snediker Ave
- 404 Hinsdale St
- 402 Hinsdale St
- 393 Snediker Ave
- 400 Hinsdale St
- 408 Hinsdale St
- 417 Snediker Ave
- 398 Hinsdale St
- 410 Hinsdale St
- 404-422 Snediker Ave