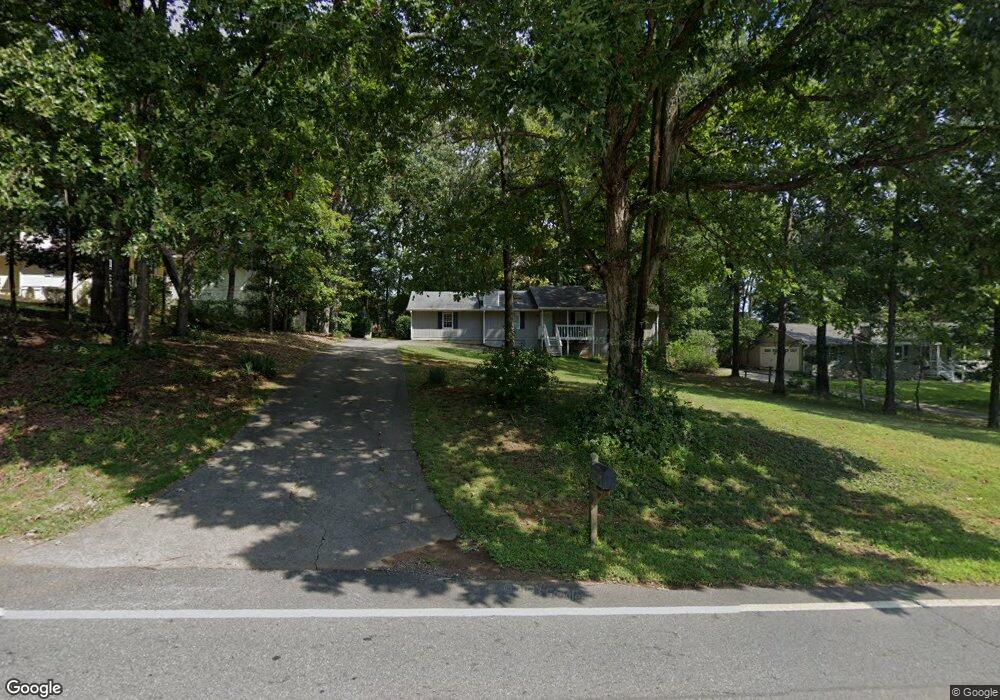
405 Strickland Rd Unit 3 Alpharetta, GA 30004
Estimated Value: $317,000 - $419,000
3
Beds
2
Baths
1,372
Sq Ft
$264/Sq Ft
Est. Value
About This Home
This home is located at 405 Strickland Rd Unit 3, Alpharetta, GA 30004 and is currently estimated at $362,788, approximately $264 per square foot. 405 Strickland Rd Unit 3 is a home located in Forsyth County with nearby schools including Brandywine Elementary School, DeSana Middle School, and Denmark High School.
Ownership History
Date
Name
Owned For
Owner Type
Purchase Details
Closed on
Feb 10, 2017
Sold by
Valdivia David A
Bought by
Valdivia Rebekah M
Current Estimated Value
Purchase Details
Closed on
Mar 11, 2004
Sold by
Littell Ricky E
Bought by
Valdivia Rebekah M and Valdivia David
Home Financials for this Owner
Home Financials are based on the most recent Mortgage that was taken out on this home.
Original Mortgage
$149,000
Interest Rate
5.68%
Mortgage Type
New Conventional
Purchase Details
Closed on
Apr 22, 2003
Sold by
Littrel Alyson A
Bought by
Littrel Rickey E
Create a Home Valuation Report for This Property
The Home Valuation Report is an in-depth analysis detailing your home's value as well as a comparison with similar homes in the area
Home Values in the Area
Average Home Value in this Area
Purchase History
| Date | Buyer | Sale Price | Title Company |
|---|---|---|---|
| Valdivia Rebekah M | $120,356 | -- | |
| Valdivia Rebekah M | $149,000 | -- | |
| Littrel Rickey E | -- | -- |
Source: Public Records
Mortgage History
| Date | Status | Borrower | Loan Amount |
|---|---|---|---|
| Previous Owner | Valdivia Rebekah M | $149,000 |
Source: Public Records
Tax History Compared to Growth
Tax History
| Year | Tax Paid | Tax Assessment Tax Assessment Total Assessment is a certain percentage of the fair market value that is determined by local assessors to be the total taxable value of land and additions on the property. | Land | Improvement |
|---|---|---|---|---|
| 2025 | $2,777 | $150,592 | $60,000 | $90,592 |
| 2024 | $2,777 | $147,240 | $60,000 | $87,240 |
| 2023 | $2,293 | $139,732 | $60,000 | $79,732 |
| 2022 | $2,563 | $90,284 | $32,000 | $58,284 |
| 2021 | $2,088 | $90,284 | $32,000 | $58,284 |
| 2020 | $1,928 | $82,536 | $24,000 | $58,536 |
| 2019 | $1,900 | $81,016 | $24,000 | $57,016 |
| 2018 | $1,606 | $66,312 | $24,000 | $42,312 |
| 2017 | $1,627 | $66,984 | $24,000 | $42,984 |
| 2016 | $1,461 | $59,144 | $20,000 | $39,144 |
| 2015 | $1,379 | $55,144 | $16,000 | $39,144 |
| 2014 | $1,240 | $51,880 | $16,000 | $35,880 |
Source: Public Records
Map
Nearby Homes
- 3584 Archgate Ct
- 390 Tidwell Rd
- 845 Miranda Terrace
- 201 Tidwell Rd
- 13974 Sunfish Bend Unit 4103
- 840 Central Park Overlook
- 860 Hargrove Point Way
- 3245 Highway 9 N
- 255 White Pines Dr
- 3332 Seaward View
- 14183 Yacht Terrace Unit 107
- 3309 Regatta Grove
- 3307 Regatta Grove
- 3299 Regatta Grove
- 550 Central Park Overlook
- 1040 Peyton View Ct
- 3309 Bethany Bend
- 6660 Tulip Plantation Rd
- 419 Grayson Way
- 1095 S Bethany Creek Dr
- 395 Strickland Rd
- 395 Strickland Rd
- 395 Strickland Rd Unit 3
- 415 Strickland Rd
- 340 Fernbank Ct
- 385 Strickland Rd
- 380 Strickland Rd
- 338 Fernbank Ct Unit 3
- 445 Strickland Rd
- 342 Fernbank Ct
- 211 Fernwood Ct
- 375 Strickland Rd
- 221 Fernwood Ct
- 336 Fernbank Ct
- 440 Strickland Rd
- 341 Fernbank Ct
- 334 Fernbank Ct Unit 3
- 370 Strickland Rd
- 365 Strickland Rd
- 339 Fernbank Ct