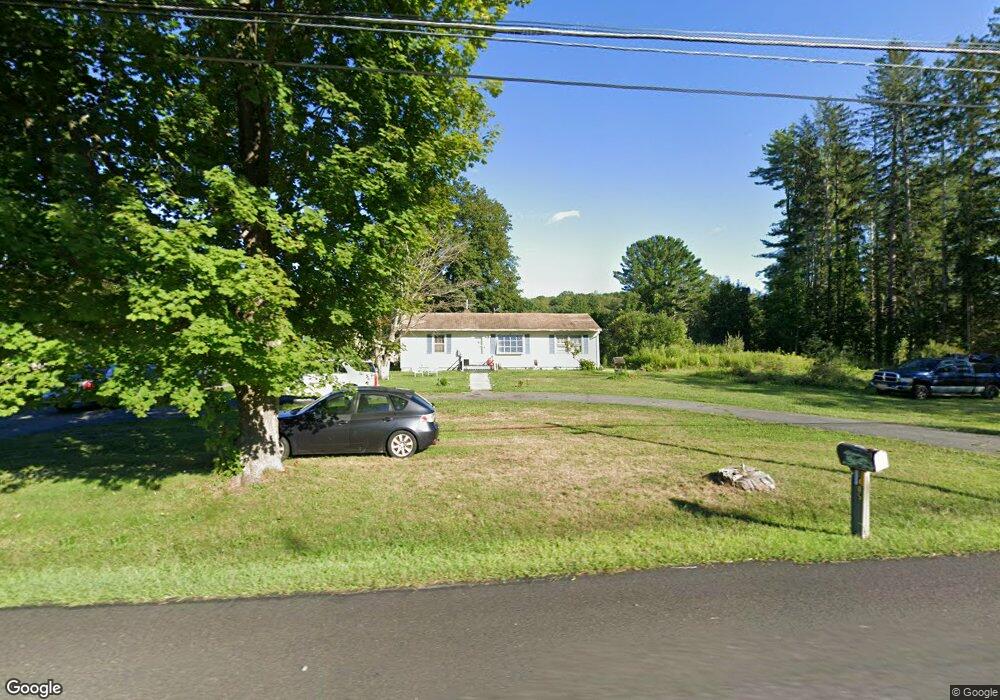
405 Us Highway 206 Montague, NJ 07827
Estimated Value: $250,000 - $280,000
--
Bed
--
Bath
1,175
Sq Ft
$229/Sq Ft
Est. Value
About This Home
This home is located at 405 Us Highway 206, Montague, NJ 07827 and is currently estimated at $268,794, approximately $228 per square foot. 405 Us Highway 206 is a home located in Sussex County with nearby schools including Sandyston-Walpack Consolidated School and Kittatinny Regional High School.
Ownership History
Date
Name
Owned For
Owner Type
Purchase Details
Closed on
Nov 12, 2015
Sold by
Solano Wilford and Malson Bonnie J
Bought by
Solando Wilfredo and Solando Bonnie J
Current Estimated Value
Home Financials for this Owner
Home Financials are based on the most recent Mortgage that was taken out on this home.
Original Mortgage
$90,000
Outstanding Balance
$70,981
Interest Rate
3.87%
Mortgage Type
New Conventional
Estimated Equity
$197,813
Purchase Details
Closed on
Mar 20, 1997
Sold by
Medrick John D and Medrick Leota W
Bought by
Solano Wilfredo and Malson Bonnie J
Home Financials for this Owner
Home Financials are based on the most recent Mortgage that was taken out on this home.
Original Mortgage
$113,846
Interest Rate
7.5%
Mortgage Type
FHA
Purchase Details
Closed on
May 28, 1996
Sold by
Medrick Leota W
Bought by
Medrick Leota W and Leota W Medrick Revocable Trust
Create a Home Valuation Report for This Property
The Home Valuation Report is an in-depth analysis detailing your home's value as well as a comparison with similar homes in the area
Home Values in the Area
Average Home Value in this Area
Purchase History
| Date | Buyer | Sale Price | Title Company |
|---|---|---|---|
| Solando Wilfredo | -- | First American Title Ins Co | |
| Solano Wilfredo | $115,000 | -- | |
| Medrick Leota W | -- | -- |
Source: Public Records
Mortgage History
| Date | Status | Borrower | Loan Amount |
|---|---|---|---|
| Open | Solando Wilfredo | $90,000 | |
| Closed | Solano Wilfredo | $113,846 |
Source: Public Records
Tax History Compared to Growth
Tax History
| Year | Tax Paid | Tax Assessment Tax Assessment Total Assessment is a certain percentage of the fair market value that is determined by local assessors to be the total taxable value of land and additions on the property. | Land | Improvement |
|---|---|---|---|---|
| 2025 | $4,217 | $143,300 | $58,500 | $84,800 |
| 2024 | $4,144 | $143,300 | $58,500 | $84,800 |
| 2023 | $4,144 | $143,300 | $58,500 | $84,800 |
| 2022 | $4,143 | $143,300 | $58,500 | $84,800 |
| 2021 | $4,214 | $143,300 | $58,500 | $84,800 |
| 2020 | $4,183 | $143,300 | $58,500 | $84,800 |
| 2019 | $4,038 | $143,300 | $58,500 | $84,800 |
| 2018 | $3,886 | $143,300 | $58,500 | $84,800 |
| 2017 | $3,759 | $143,300 | $58,500 | $84,800 |
| 2016 | $3,720 | $143,300 | $58,500 | $84,800 |
| 2015 | $3,577 | $143,300 | $58,500 | $84,800 |
| 2014 | $4,379 | $111,600 | $33,000 | $78,600 |
Source: Public Records
Map
Nearby Homes
- 16 Doremus Ln
- 3 Volker Ln
- 15 Bills Ln
- 174 County Road 645
- 163 County Road 645
- 8 Ayers Rd
- 161A County Road 645
- 176 New Rd
- 5 Twin Pond Rd
- 43 Meyers Rd
- 27 Rubin Hill Rd
- 126 Armstrong Rd
- 285 New Rd
- 111 County Road 645
- 115 Overlook Dr
- 00 Devita Rd
- 365 Rolling Ridge Rd
- 102 Hidden Glen
- 390 Lake Shore W Unit B
- 384-A Lake Shore S Unit B
- 407 Us Highway 206
- 350 Us Highway 206
- 409 Us Highway 206
- 13 Doremus Ln
- 413 Route 206
- 413 Us Highway 206
- 413 Us Highway 206 Unit 1
- 348 Us Highway 206
- 11 Doremus Ln
- 15 Doremus Ln
- 9 Doremus Ln
- 20 Doremus Ln
- 18 Doremus Ln
- 3 Doremus Ln
- 1 Doremus Ln
- 346 Us Highway 206
- 5 Doremus Ln
- 346 U S 206
- 22 Doremus Ln
- 7 Doremus Ln