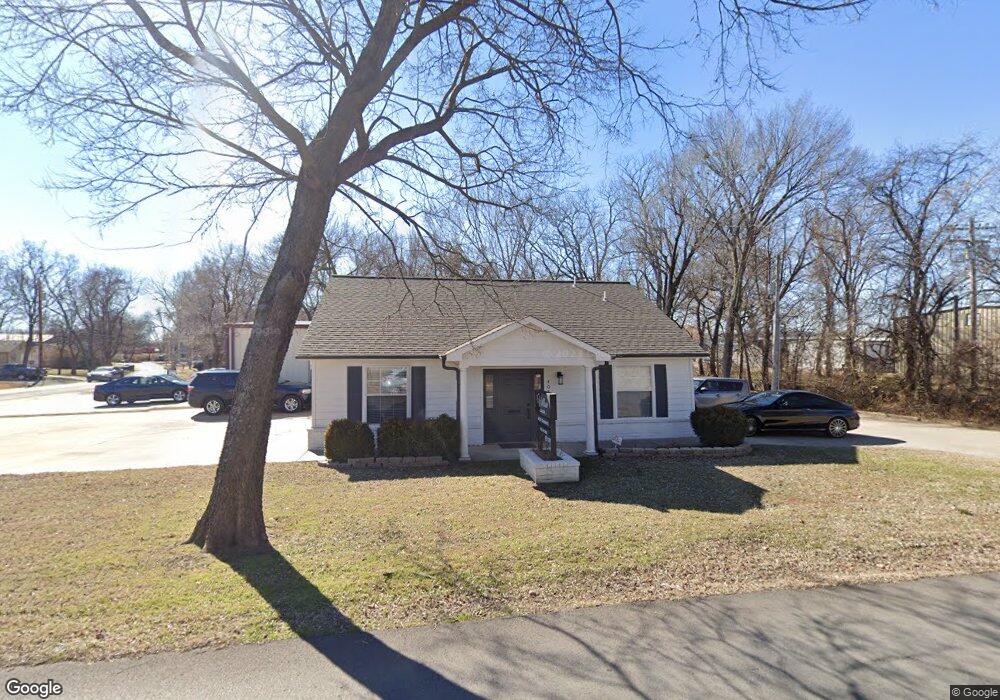
405 W Claremore St Claremore, OK 74017
Estimated Value: $174,797
--
Bed
--
Bath
1,190
Sq Ft
$147/Sq Ft
Est. Value
About This Home
This home is located at 405 W Claremore St, Claremore, OK 74017 and is currently estimated at $174,797, approximately $146 per square foot. 405 W Claremore St is a home located in Rogers County with nearby schools including Claremont Elementary School, Will Rogers Junior High School, and Claremore High School.
Ownership History
Date
Name
Owned For
Owner Type
Purchase Details
Closed on
Sep 5, 2019
Sold by
Hood Holdings Llc
Bought by
Underwood Christopher Lee and Underwood Kimberly D
Current Estimated Value
Purchase Details
Closed on
Jan 16, 2015
Sold by
Violet F Kirkendall Cpa Pc
Bought by
Hood Holdings Llc
Home Financials for this Owner
Home Financials are based on the most recent Mortgage that was taken out on this home.
Original Mortgage
$136,800
Interest Rate
3.83%
Mortgage Type
Commercial
Purchase Details
Closed on
Dec 26, 2003
Sold by
Kirkendall Violet F
Purchase Details
Closed on
Mar 31, 2003
Sold by
Chandler Marjorie O and Chandler Et~Al
Create a Home Valuation Report for This Property
The Home Valuation Report is an in-depth analysis detailing your home's value as well as a comparison with similar homes in the area
Home Values in the Area
Average Home Value in this Area
Purchase History
| Date | Buyer | Sale Price | Title Company |
|---|---|---|---|
| Underwood Christopher Lee | $110,000 | Chicago Title Insurance Co | |
| Hood Holdings Llc | $179,000 | None Available | |
| -- | -- | -- | |
| -- | $15,000 | -- |
Source: Public Records
Mortgage History
| Date | Status | Borrower | Loan Amount |
|---|---|---|---|
| Previous Owner | Hood Holdings Llc | $136,800 |
Source: Public Records
Tax History Compared to Growth
Tax History
| Year | Tax Paid | Tax Assessment Tax Assessment Total Assessment is a certain percentage of the fair market value that is determined by local assessors to be the total taxable value of land and additions on the property. | Land | Improvement |
|---|---|---|---|---|
| 2025 | $1,898 | $20,536 | $3,740 | $16,796 |
| 2024 | $1,807 | $19,557 | $3,740 | $15,817 |
| 2023 | $1,807 | $20,077 | $3,740 | $16,337 |
| 2022 | $1,856 | $20,052 | $3,740 | $16,312 |
| 2021 | $1,738 | $19,683 | $3,740 | $15,943 |
| 2020 | $1,802 | $19,683 | $3,740 | $15,943 |
| 2019 | $1,183 | $12,839 | $3,740 | $9,099 |
| 2018 | $1,124 | $12,166 | $3,740 | $8,426 |
| 2017 | $1,117 | $12,166 | $3,740 | $8,426 |
| 2016 | $1,766 | $18,810 | $3,740 | $15,070 |
| 2015 | $1,249 | $13,474 | $3,740 | $9,734 |
| 2014 | $1,249 | $13,474 | $3,740 | $9,734 |
Source: Public Records
Map
Nearby Homes
- 202 W 4th St
- 321 E Patti Page Blvd
- 317 E 4th St
- 402 E Patti Page Blvd
- 1230 W Dupont St
- 417 E Will Rogers Blvd
- 104 W 7th St
- 509 N Weenonah Ave
- 1206 W Haskell St
- 203 W 9th St S
- 308 E Fry Ct
- 902 W 8th St
- 119 N Missouri Ave
- 1410 W Danny St
- 208 N Chambers Trail
- 121 W 9th Place S
- 520 E 6th St
- 522 E 6th St
- 16111 Oklahoma 88
- 0 N J M Davis Blvd
- 410 Claremore Rt 5
- 406 Claremore Rt 6
- 406.B Claremore Rt 5
- 406.A Claremore Rt 5
- 404 Claremore Rt 3
- 395 W Claremore St
- 396 W Claremore St
- 400 Claremore Rt 2
- 329 S Cherokee Ave
- 387 W Claremore St
- 446 Claremore Rt 9
- 392 W Claremore St
- 381 W Claremore St
- 452 Claremore Rt 5
- 456.A Claremore Rt 5
- 456 Claremore Rt 5
- 458.A Claremore Rt 5
- 369 W Claremore St
- 421 W Claremore St
- 421.A Claremore Rt 5