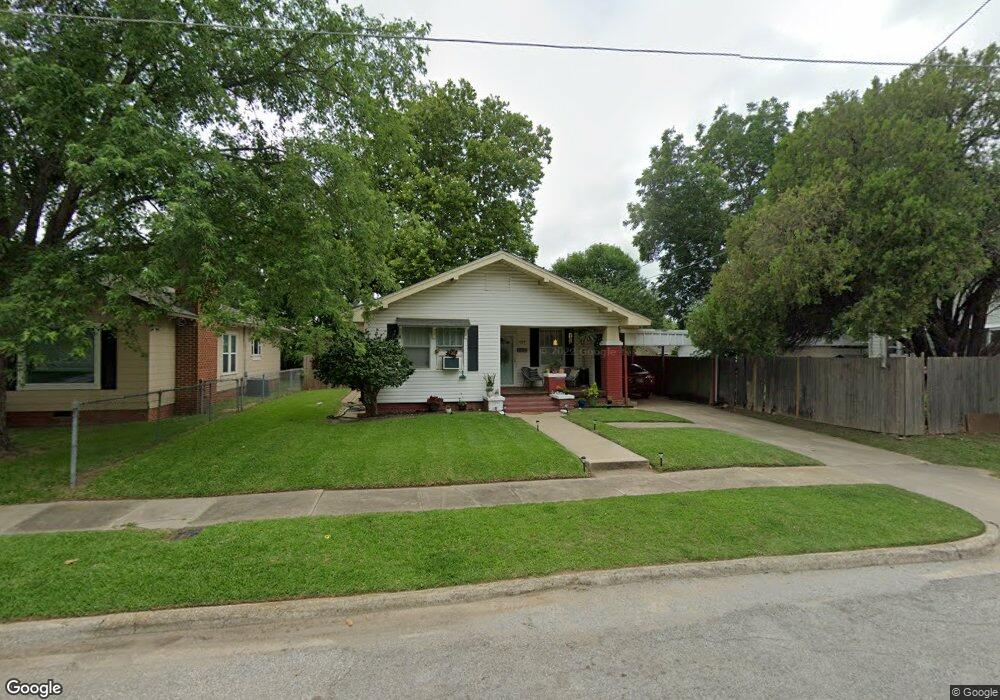
405 Wheeler St SW Ardmore, OK 73401
Estimated Value: $108,000 - $127,000
2
Beds
1
Bath
1,224
Sq Ft
$96/Sq Ft
Est. Value
About This Home
This home is located at 405 Wheeler St SW, Ardmore, OK 73401 and is currently estimated at $117,497, approximately $95 per square foot. 405 Wheeler St SW is a home located in Carter County with nearby schools including Lincoln Elementary School, Ardmore Middle School, and Ardmore High School.
Ownership History
Date
Name
Owned For
Owner Type
Purchase Details
Closed on
Aug 26, 2014
Sold by
Tivis Kenneth E and Tivis Derrel K
Bought by
Hatton Jared C and Hatton Jerry
Current Estimated Value
Purchase Details
Closed on
Jun 12, 2008
Sold by
Lynn Calhoun Terry Lynn and Lynn Christopher Terry
Bought by
Holquin Eric J
Home Financials for this Owner
Home Financials are based on the most recent Mortgage that was taken out on this home.
Original Mortgage
$47,197
Interest Rate
6.05%
Mortgage Type
FHA
Purchase Details
Closed on
Apr 30, 2001
Sold by
Brown Nina C
Bought by
Calhoun Terry
Purchase Details
Closed on
Mar 10, 1999
Sold by
Brown Floyd J and Brown Nina
Bought by
Brown Nina C
Purchase Details
Closed on
Jul 15, 1996
Sold by
Brown Floyd J
Bought by
Brown Floyd J and Brown Nina
Purchase Details
Closed on
Feb 22, 1994
Sold by
Harrell Faye
Bought by
Brown Floyd J
Create a Home Valuation Report for This Property
The Home Valuation Report is an in-depth analysis detailing your home's value as well as a comparison with similar homes in the area
Home Values in the Area
Average Home Value in this Area
Purchase History
| Date | Buyer | Sale Price | Title Company |
|---|---|---|---|
| Hatton Jared C | -- | None Available | |
| Holquin Eric J | $48,000 | -- | |
| Calhoun Terry | -- | -- | |
| Brown Nina C | -- | -- | |
| Brown Floyd J | -- | -- | |
| Brown Floyd J | $28,000 | -- |
Source: Public Records
Mortgage History
| Date | Status | Borrower | Loan Amount |
|---|---|---|---|
| Previous Owner | Holquin Eric J | $47,197 |
Source: Public Records
Tax History Compared to Growth
Tax History
| Year | Tax Paid | Tax Assessment Tax Assessment Total Assessment is a certain percentage of the fair market value that is determined by local assessors to be the total taxable value of land and additions on the property. | Land | Improvement |
|---|---|---|---|---|
| 2024 | $1,066 | $10,175 | $1,200 | $8,975 |
| 2023 | $1,016 | $9,690 | $1,200 | $8,490 |
| 2022 | $882 | $9,229 | $1,200 | $8,029 |
| 2021 | $887 | $8,790 | $1,200 | $7,590 |
| 2020 | $832 | $8,371 | $1,200 | $7,171 |
| 2019 | $795 | $8,190 | $1,200 | $6,990 |
| 2018 | $770 | $7,800 | $1,200 | $6,600 |
| 2017 | $560 | $7,127 | $1,020 | $6,107 |
| 2016 | $552 | $6,920 | $957 | $5,963 |
| 2015 | $506 | $6,590 | $825 | $5,765 |
| 2014 | $562 | $6,277 | $633 | $5,644 |
Source: Public Records
Map
Nearby Homes
- 416 Wheeler St SW
- 407 S Commerce St
- 1201 5th Ave SW
- 1203 SW 4th
- 420 K St SW
- 532 Hammers Rd
- 332 I St SW
- 1301 3rd Ave SW
- 711 N St SW
- 1317 3rd Ave SW
- 1103 Stanley St SW
- 1209 Stanley St SW
- 822 Stanley St SW
- 1418 3rd Ave SW
- 1206 Bixby St
- 526 H St SW
- 711 3rd Ave SW
- 509 G St SW
- 1424 Stanley St SW
- 1105 Bixby St
- 407 Wheeler St SW
- 1102 4th Ave SW
- 411 Wheeler St SW
- 404 S Commerce St
- 1020 4th Ave SW
- 412 Wheeler St SW
- 1018 4th Ave SW
- 419 Wheeler St SW
- 1101 4th Ave SW
- 1016 4th Ave SW
- 414 S Commerce St
- 421 Wheeler St SW
- 426 Wheeler St SW
- 423 Wheeler St SW
- 325 Wheeler St SW
- 430 Wheeler St SW
- 324 Wheeler St SW
- 411 K St SW
- 417 K St SW
- 409 K St SW