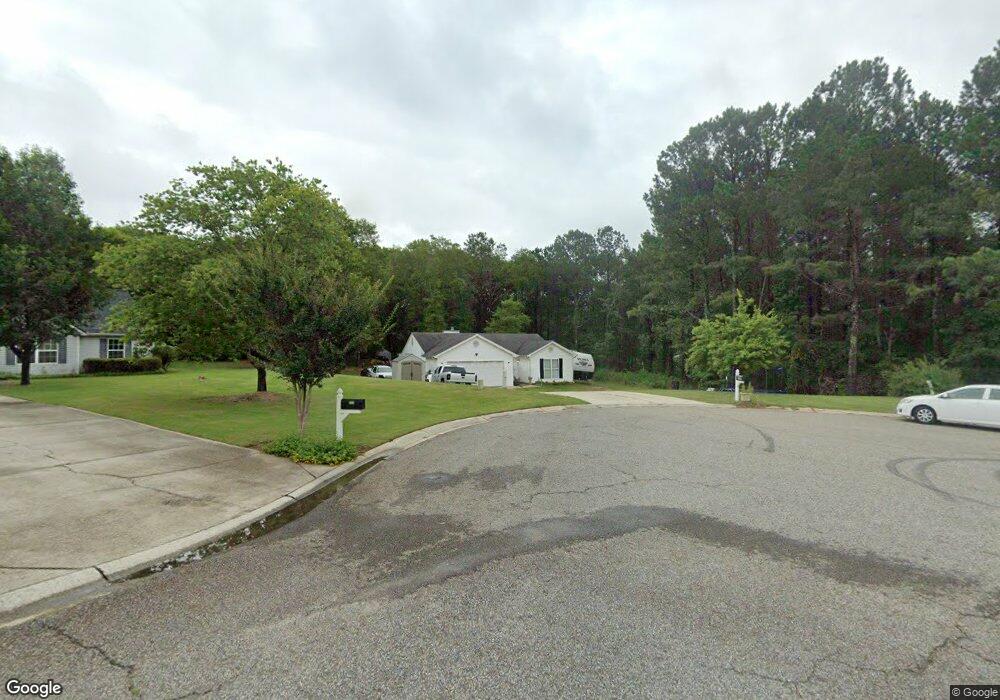
405 Wilshire Ln Unit 2 Bethlehem, GA 30620
Estimated Value: $290,000 - $322,000
3
Beds
2
Baths
1,310
Sq Ft
$236/Sq Ft
Est. Value
About This Home
This home is located at 405 Wilshire Ln Unit 2, Bethlehem, GA 30620 and is currently estimated at $308,562, approximately $235 per square foot. 405 Wilshire Ln Unit 2 is a home located in Barrow County with nearby schools including Bethlehem Elementary School, Haymon-Morris Middle School, and Apalachee High School.
Ownership History
Date
Name
Owned For
Owner Type
Purchase Details
Closed on
Feb 23, 2018
Sold by
Makido Brian
Bought by
Urban Shawn
Current Estimated Value
Home Financials for this Owner
Home Financials are based on the most recent Mortgage that was taken out on this home.
Original Mortgage
$142,274
Outstanding Balance
$121,889
Interest Rate
4.37%
Mortgage Type
FHA
Estimated Equity
$186,673
Purchase Details
Closed on
Aug 31, 2010
Sold by
Wells Fargo Series 2005-4
Bought by
Makido Brian and Makido Jacqueline
Home Financials for this Owner
Home Financials are based on the most recent Mortgage that was taken out on this home.
Original Mortgage
$90,562
Interest Rate
4.59%
Mortgage Type
New Conventional
Purchase Details
Closed on
Apr 6, 2010
Sold by
Tucker Damien
Bought by
Wells Fargo Series 2005-4
Purchase Details
Closed on
Mar 21, 2005
Sold by
Sun King Ventures Llc
Bought by
Southfork Homes Inc
Purchase Details
Closed on
Jun 14, 2004
Bought by
Sun King Ventures Llc
Create a Home Valuation Report for This Property
The Home Valuation Report is an in-depth analysis detailing your home's value as well as a comparison with similar homes in the area
Home Values in the Area
Average Home Value in this Area
Purchase History
| Date | Buyer | Sale Price | Title Company |
|---|---|---|---|
| Urban Shawn | $144,900 | -- | |
| Makido Brian | $87,500 | -- | |
| Wells Fargo Series 2005-4 | $90,000 | -- | |
| Hsbc Bank Usa | -- | -- | |
| Southfork Homes Inc | $35,000 | -- | |
| Sun King Ventures Llc | -- | -- |
Source: Public Records
Mortgage History
| Date | Status | Borrower | Loan Amount |
|---|---|---|---|
| Open | Urban Shawn | $142,274 | |
| Previous Owner | Makido Brian | $90,562 |
Source: Public Records
Tax History Compared to Growth
Tax History
| Year | Tax Paid | Tax Assessment Tax Assessment Total Assessment is a certain percentage of the fair market value that is determined by local assessors to be the total taxable value of land and additions on the property. | Land | Improvement |
|---|---|---|---|---|
| 2024 | $2,259 | $94,462 | $24,000 | $70,462 |
| 2023 | $2,304 | $84,302 | $13,440 | $70,862 |
| 2022 | $1,710 | $62,647 | $13,440 | $49,207 |
| 2021 | $1,800 | $62,647 | $13,440 | $49,207 |
| 2020 | $1,802 | $62,647 | $13,440 | $49,207 |
| 2019 | $1,663 | $57,041 | $11,200 | $45,841 |
| 2018 | $1,435 | $50,309 | $11,200 | $39,109 |
| 2017 | $1,185 | $40,692 | $9,200 | $31,492 |
| 2016 | $1,034 | $38,026 | $11,600 | $26,426 |
| 2015 | $1,047 | $38,312 | $11,600 | $26,712 |
| 2014 | $915 | $33,858 | $6,860 | $26,998 |
| 2013 | -- | $32,528 | $6,860 | $25,668 |
Source: Public Records
Map
Nearby Homes
- 824 Pruitt Rd
- 449 & 455 Carl-Bethlehem Rd
- 755 Harry McCarty Rd
- 575 Mackinaw Dr
- 758 Clarence Edwards Rd
- 0 Jb Owens Unit LOT 2 - 2.09 ACRES
- 0 Jb Owens Unit LOT 3 - 2.01 ACRES
- 0 Jb Owens Unit 7552902
- 0 Jb Owens Unit 7552891
- 0 McElhannon Rd SW Unit 10581793
- 0 Manger Ave E Unit 20154677
- 0 Manger Ave E Unit 20127001
- 784 Manger Ave
- 724 Manger Ave
- 176 Market St
- 236 Vision St
- 1109 Ravenwood Dr
- 0 Clarence Edwards Rd Unit 10587376
- 1101 Ravenwood Dr
- 528 Harris Dr
- 405 Wilshire Ln
- 407 Wilshire Ln
- 403 Wilshire Ln
- 409 Wilshire Ln Unit 2
- 863 Brisco Mill Rd
- 408 Wilshire Ln
- 859 Brisco Mill Rd
- 410 Wilshire Ln
- 413 Wilshire Ln
- 1020 Maggie Dr
- 1016 Maggie Dr
- 1022 Maggie Dr
- 503 Zinfandel Dr Unit 2
- 412 Wilshire Ln Unit 2
- 0 Zinfandel Dr Unit 8369343
- 0 Zinfandel Dr
- 1014 Maggie Dr
- 841 Brisco Mill Rd
- 1024 Maggie Dr Unit 2
- 504 Zinfandel Dr