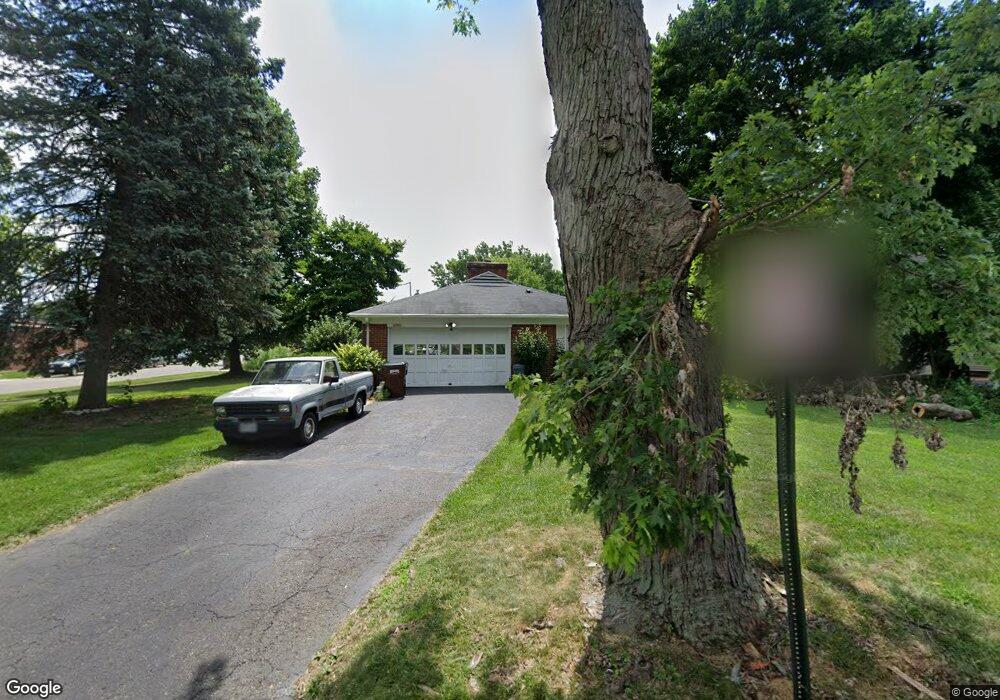
4050 Breckenridge Rd Dayton, OH 45429
Estimated Value: $249,800 - $276,000
3
Beds
2
Baths
1,496
Sq Ft
$175/Sq Ft
Est. Value
About This Home
This home is located at 4050 Breckenridge Rd, Dayton, OH 45429 and is currently estimated at $261,950, approximately $175 per square foot. 4050 Breckenridge Rd is a home located in Montgomery County with nearby schools including Southdale Elementary School, Van Buren Middle School, and Kettering Fairmont High School.
Ownership History
Date
Name
Owned For
Owner Type
Purchase Details
Closed on
Dec 20, 2018
Sold by
Snodgrass Ireane M
Bought by
Fox Sharma C
Current Estimated Value
Home Financials for this Owner
Home Financials are based on the most recent Mortgage that was taken out on this home.
Original Mortgage
$88,780
Outstanding Balance
$77,328
Interest Rate
4.25%
Mortgage Type
Adjustable Rate Mortgage/ARM
Estimated Equity
$184,622
Purchase Details
Closed on
Sep 13, 2017
Sold by
Snodgrass Irene M
Bought by
Snodgrass Irene M
Purchase Details
Closed on
Sep 28, 2004
Sold by
Snodgrass Robert R and Snodgrass Irene M
Bought by
Snodgrass Robert R and Snodgrass Irene M
Purchase Details
Closed on
Dec 19, 1997
Sold by
Pacovsky James L and Pacovsky Dawn M
Bought by
Snodgrass Robert R and Snodgrass Irene M
Create a Home Valuation Report for This Property
The Home Valuation Report is an in-depth analysis detailing your home's value as well as a comparison with similar homes in the area
Home Values in the Area
Average Home Value in this Area
Purchase History
| Date | Buyer | Sale Price | Title Company |
|---|---|---|---|
| Fox Sharma C | $111,000 | Landmark Title Agency South | |
| Snodgrass Irene M | -- | None Available | |
| Snodgrass Robert R | -- | None Available | |
| Snodgrass Robert R | $102,000 | -- |
Source: Public Records
Mortgage History
| Date | Status | Borrower | Loan Amount |
|---|---|---|---|
| Open | Fox Sharma C | $88,780 |
Source: Public Records
Tax History Compared to Growth
Tax History
| Year | Tax Paid | Tax Assessment Tax Assessment Total Assessment is a certain percentage of the fair market value that is determined by local assessors to be the total taxable value of land and additions on the property. | Land | Improvement |
|---|---|---|---|---|
| 2024 | $3,426 | $64,350 | $16,850 | $47,500 |
| 2023 | $3,426 | $64,350 | $16,850 | $47,500 |
| 2022 | $3,091 | $48,100 | $12,570 | $35,530 |
| 2021 | $2,859 | $48,100 | $12,570 | $35,530 |
| 2020 | $2,867 | $48,100 | $12,570 | $35,530 |
| 2019 | $3,295 | $40,030 | $11,960 | $28,070 |
| 2018 | $2,594 | $40,030 | $11,960 | $28,070 |
| 2017 | $2,389 | $40,030 | $11,960 | $28,070 |
| 2016 | $2,572 | $40,410 | $11,960 | $28,450 |
| 2015 | $2,457 | $40,410 | $11,960 | $28,450 |
| 2014 | $2,457 | $40,410 | $11,960 | $28,450 |
| 2012 | -- | $36,540 | $12,130 | $24,410 |
Source: Public Records
Map
Nearby Homes
- 298 Marchester Dr
- 115 N Bromfield Rd
- 305 Glenridge Rd
- 604 Schuyler Dr
- 4259 Maxlin Rd
- 645 Brookfield Rd
- 791 Willowdale Ave
- 3212 Lenox Dr
- 3993 Applewood Ln
- 101 Blue Gate Cir Unit 1
- 3325 Ridgeway Rd
- 3822 Milford Dr
- 804 Lovetta Dr
- 4241 Schrubb Dr
- 503 Cottingwood Ct
- 855 Brookfield Rd
- 117 Cushing Ave
- 587 Cottingwood Ct
- 424 Cushing Ave
- 4808 Judith Dr
- 4066 Breckenridge Rd
- 85 Southmoor Cir SW
- 23 Sherbrooke Dr
- 101 Balmoral Dr
- 33 Sherbrooke Dr
- 19 Sherbrooke Dr
- 100 Balmoral Dr
- 15 Sherbrooke Dr
- 101 Sherbrooke Dr
- 117 Balmoral Dr
- 110 Balmoral Dr
- 100 W Stroop Rd
- 18 Sherbrooke Dr
- 4100 Breckenridge Rd
- 109 Sherbrooke Dr
- 10 Sherbrooke Dr
- 124 W Stroop Rd
- 2 Sherbrooke Dr
- 118 Balmoral Dr
- 4101 Breckenridge Rd