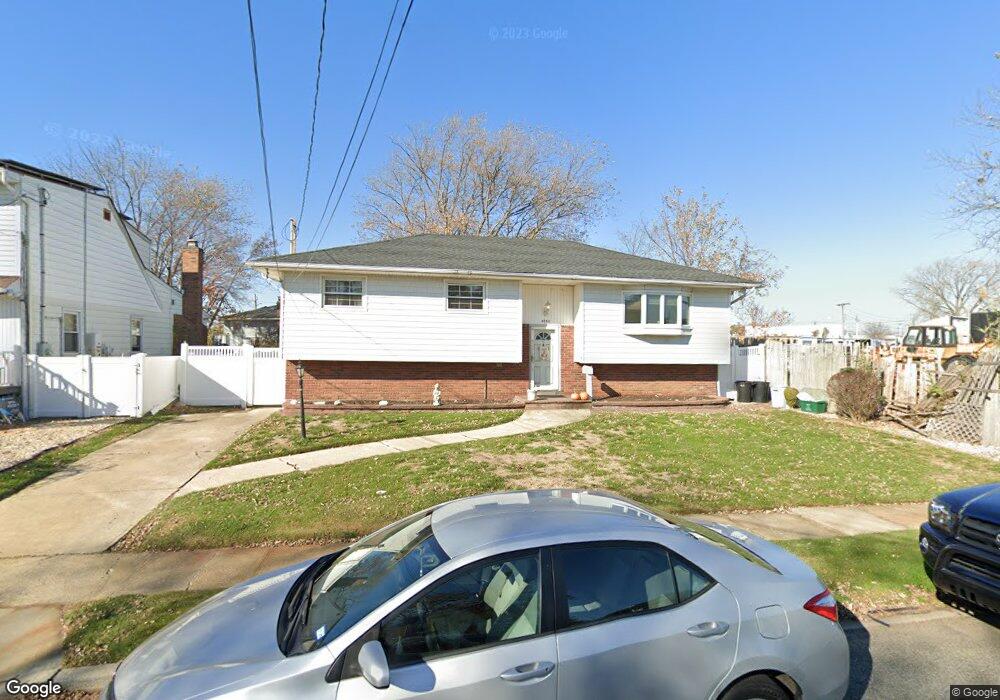
4050 Massachusetts Ave Island Park, NY 11558
Estimated Value: $526,000 - $751,804
--
Bed
2
Baths
1,201
Sq Ft
$532/Sq Ft
Est. Value
About This Home
This home is located at 4050 Massachusetts Ave, Island Park, NY 11558 and is currently estimated at $638,902, approximately $531 per square foot. 4050 Massachusetts Ave is a home located in Nassau County with nearby schools including Francis X Hegarty Elementary School, Lincoln Orens Middle School, and Torah High School Long Beach.
Ownership History
Date
Name
Owned For
Owner Type
Purchase Details
Closed on
Apr 29, 2024
Sold by
Rivera Susan Dagostino and Logstin Susan D
Bought by
Robson Nicole and Robson Daryl
Current Estimated Value
Home Financials for this Owner
Home Financials are based on the most recent Mortgage that was taken out on this home.
Original Mortgage
$521,550
Outstanding Balance
$513,259
Interest Rate
6.87%
Mortgage Type
New Conventional
Estimated Equity
$125,643
Purchase Details
Closed on
Apr 3, 2009
Sold by
Rivera Susan Dagostino and Rivera Victor
Bought by
Rivers Susan Dagostino
Purchase Details
Closed on
Jun 20, 2006
Sold by
Dagostino Susan
Purchase Details
Closed on
Apr 20, 2005
Sold by
Cruz Susan
Purchase Details
Closed on
Apr 26, 2001
Create a Home Valuation Report for This Property
The Home Valuation Report is an in-depth analysis detailing your home's value as well as a comparison with similar homes in the area
Home Values in the Area
Average Home Value in this Area
Purchase History
| Date | Buyer | Sale Price | Title Company |
|---|---|---|---|
| Robson Nicole | $549,000 | Stewart Title Insurance Co | |
| Robson Nicole | $549,000 | Stewart Title Insurance Co | |
| Rivers Susan Dagostino | -- | Title Vest | |
| Rivers Susan Dagostino | -- | Title Vest | |
| Rivers Susan Dagostino | -- | Title Vest | |
| -- | $237,500 | -- | |
| -- | $237,500 | -- | |
| -- | -- | -- | |
| -- | -- | -- | |
| -- | -- | -- | |
| -- | -- | -- |
Source: Public Records
Mortgage History
| Date | Status | Borrower | Loan Amount |
|---|---|---|---|
| Open | Robson Nicole | $521,550 | |
| Closed | Robson Nicole | $521,550 |
Source: Public Records
Tax History Compared to Growth
Tax History
| Year | Tax Paid | Tax Assessment Tax Assessment Total Assessment is a certain percentage of the fair market value that is determined by local assessors to be the total taxable value of land and additions on the property. | Land | Improvement |
|---|---|---|---|---|
| 2025 | $10,993 | $444 | $186 | $258 |
| 2024 | $3,278 | $444 | $186 | $258 |
| 2023 | $10,129 | $444 | $186 | $258 |
| 2022 | $10,129 | $444 | $186 | $258 |
| 2021 | $13,351 | $422 | $177 | $245 |
| 2020 | $10,504 | $908 | $518 | $390 |
| 2019 | $10,904 | $908 | $518 | $390 |
| 2018 | $10,428 | $908 | $0 | $0 |
| 2017 | $6,254 | $908 | $518 | $390 |
| 2016 | $9,907 | $908 | $518 | $390 |
| 2015 | $3,426 | $908 | $518 | $390 |
| 2014 | $3,426 | $908 | $518 | $390 |
| 2013 | $3,197 | $908 | $518 | $390 |
Source: Public Records
Map
Nearby Homes
- 4081 Massachusetts Ave
- 65 Florida Ave
- 210 Saratoga Blvd
- 31 Parente Ln N
- 86 Empire Blvd
- 0 Nevada Ave
- 541 Long Beach Rd
- 187 Nassau Ln
- 80 Newport Rd
- 41 Newport Rd
- 33 Newport Rd
- 104 Ostend Rd
- 41 Ostend Rd
- 255 Delaware Ave
- 175 Hamilton Ave
- 163 Vanderbilt Ave
- 9 Hamilton Ave
- 19 Parma Rd
- 100 Daly Blvd Unit 411
- 100 Daly Blvd Unit 410
- 4056 Massachusetts Ave
- 4055 Broadway
- 4059 Broadway
- 4062 Massachusetts Ave
- 4065 Broadway
- 4045 Massachusetts Ave
- 4055 Massachusetts Ave
- 4068 Massachusetts Ave
- 4071 Broadway
- 4061 Massachusetts Ave
- 4061 Massachusetts Ave
- 4069 Massachusetts Ave
- 4074 Massachusetts Ave
- 4074 Massachusetts Ave
- 4077 Broadway
- 4052 Connecticut Ave
- 4052 Connecticut Ave Unit Upper
- 4060 Connecticut Ave
- 4044 Connecticut Ave
- 4075 Massachusetts Ave