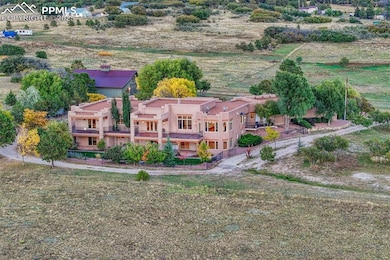
4050 Old Ranch Rd Colorado Springs, CO 80908
Estimated payment $13,029/month
Highlights
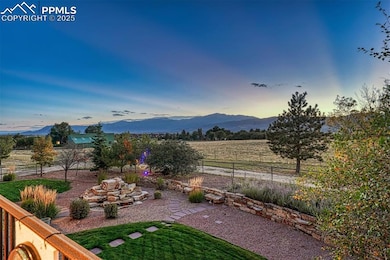
- Views of Pikes Peak
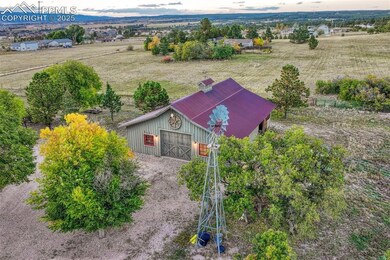
- Barn
- Greenhouse
- Pine Creek High School Rated A
- Stables
- RV Garage
About This Home
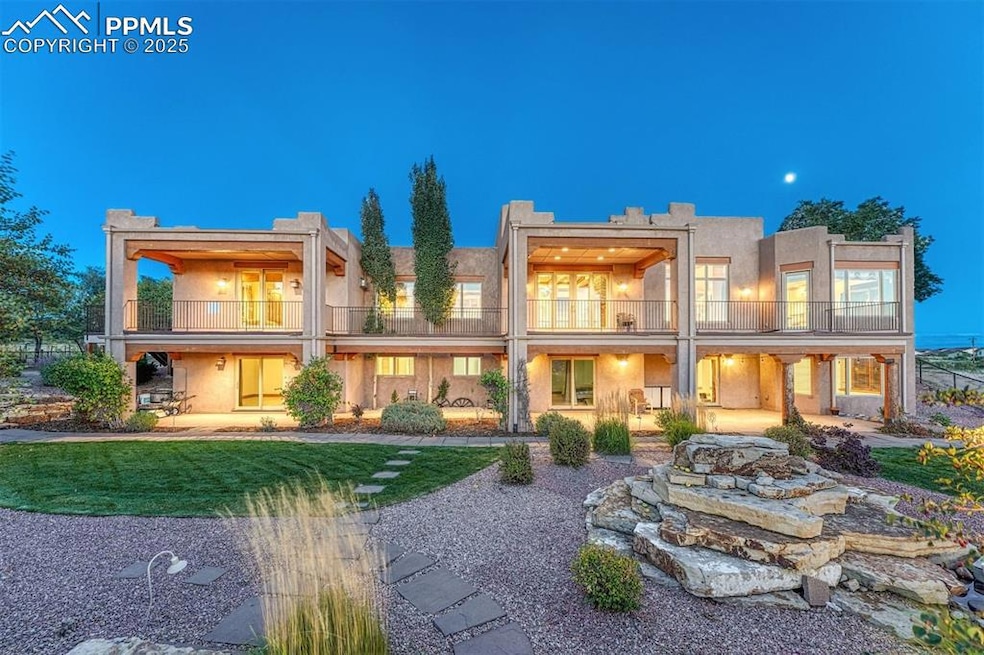
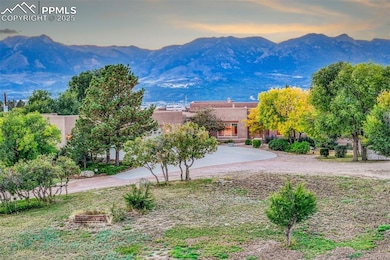
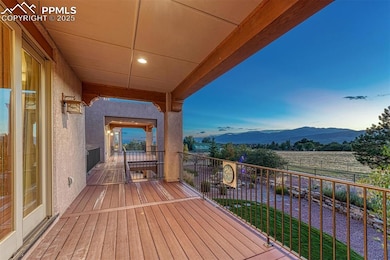
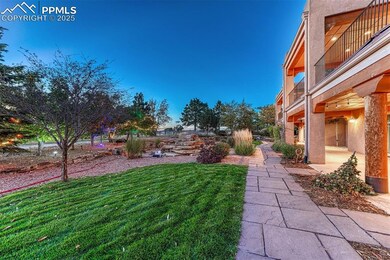
Contemporary Hacienda-inspired estate located in sought after and close-in southwest Black Forest on 6.27 acres. Sweeping 180 mile views of Pikes Peak, the surrounding mountains and the twinkling city lights in the evening. Sprawling luxury ranch home w/ stunning Spanish architecture spans over 10,000 square feet w/ walk-out basement, living areas designed around phenomenal view corridors with indoor-outdoor living at top of mind, all ensuite primary bedrooms, 3 laundry rooms, 6 baths and an expansive 78x11 composite deck with the captivating mountain views. Four car attached, heated and oversized garage. Stylish 39x48 workshop/RV garage/barn with electric, two animal stalls, large overhead door with water and electric. This is the best of both worlds - living on serene acreage w/ no covenants or HOA while having the best amenities mere minutes from your location. Over 2,000 acres of open space w/ equestrian trails, playgrounds and parks within 10 minutes. Quick access to two major hospitals, the Air Force Academy, The Flying Horse Golf Course and all of the amenities of Briargate and Northgate. Gormet kitchen w/ two tone cabinetry, gas commercial range, Sub-zero refrigerator, warming drawer, pot filler, slab stone counters, gorgeous wood floors and an abundance of storage. Four primary suites - two on each level. The home features sprawling room sizes, expansive high quality windows centered on views, central air conditioning, wood beamed ceilings, custom built-ins, 3 fireplaces, tall ceilings throughout, high end trim, crown moulding and doors. Finished walk-out lower level w/ secondary kitchen, 3rd laundry, large wet bar, theater room and family room. Lush landscape w/ boulder water feature, lush green lawns, beautiful flower, a variety of trees, fenced yard, raised garden beds and a greenhouse. Zoned for horses, additional outbuildings and other animals. Fenced and electronic gate w/ stately stone entrance. All paved and county maintained roads to the property.
Listing Agent
LIV Sotheby's International Realty CO Springs Brokerage Phone: (719) 578-8800 Listed on: 10/14/2025
Home Details
Home Type
- Single Family
Est. Annual Taxes
- $8,002
Year Built
- Built in 2006
Lot Details
- 6.27 Acre Lot
- Dog Run
- Level Lot
- Meadow
- Landscaped with Trees
- Additional Parcels
Parking
- 7 Car Garage
- Heated Garage
- Workshop in Garage
- Garage Door Opener
- Drive Through
- Gravel Driveway
- RV Garage
Property Views
- Pikes Peak
- Mountain
Home Design
- Ranch Style House
- Stucco
Interior Spaces
- 10,082 Sq Ft Home
- Crown Molding
- Beamed Ceilings
- Vaulted Ceiling
- Ceiling Fan
- Skylights
- Multiple Fireplaces
- Gas Fireplace
- French Doors
- Six Panel Doors
- Great Room
Kitchen
- Plumbed For Gas In Kitchen
- Range Hood
- Microwave
- Dishwasher
- Trash Compactor
- Disposal
Flooring
- Wood
- Carpet
Bedrooms and Bathrooms
- 4 Bedrooms
Laundry
- Laundry Room
- Dryer
- Washer
Basement
- Walk-Out Basement
- Basement Fills Entire Space Under The House
- Fireplace in Basement
- Laundry in Basement
Outdoor Features
- Covered Patio or Porch
- Greenhouse
- Shed
- Shop
Location
- Property is near a park
- Property near a hospital
- Property is near schools
- Property is near shops
Utilities
- Forced Air Heating and Cooling System
- Heating System Uses Natural Gas
- 1 Water Well
Additional Features
- Ramped or Level from Garage
- Barn
- Stables
Map
Home Values in the Area
Average Home Value in this Area
Tax History
| Year | Tax Paid | Tax Assessment Tax Assessment Total Assessment is a certain percentage of the fair market value that is determined by local assessors to be the total taxable value of land and additions on the property. | Land | Improvement |
|---|---|---|---|---|
| 2025 | $8,485 | $113,040 | -- | -- |
| 2024 | $8,016 | $121,920 | $16,170 | $105,750 |
| 2023 | $8,016 | $121,920 | $16,170 | $105,750 |
| 2022 | $7,752 | $108,540 | $13,620 | $94,920 |
| 2021 | $8,487 | $111,680 | $14,020 | $97,660 |
| 2020 | $7,905 | $98,110 | $12,820 | $85,290 |
| 2019 | $7,598 | $98,110 | $12,820 | $85,290 |
| 2018 | $6,129 | $81,640 | $10,810 | $70,830 |
| 2017 | $6,703 | $81,640 | $10,810 | $70,830 |
| 2016 | $6,539 | $79,480 | $11,950 | $67,530 |
| 2015 | $6,532 | $79,480 | $11,950 | $67,530 |
| 2014 | $6,555 | $79,590 | $13,020 | $66,570 |
Property History
| Date | Event | Price | List to Sale | Price per Sq Ft |
|---|---|---|---|---|
| 10/14/2025 10/14/25 | For Sale | $2,350,000 | -- | $233 / Sq Ft |
Purchase History
| Date | Type | Sale Price | Title Company |
|---|---|---|---|
| Quit Claim Deed | -- | None Listed On Document | |
| Interfamily Deed Transfer | -- | Peoples National Title | |
| Personal Reps Deed | $375,000 | -- | |
| Warranty Deed | $158,000 | Capital Title Services | |
| Deed | -- | -- |
Mortgage History
| Date | Status | Loan Amount | Loan Type |
|---|---|---|---|
| Previous Owner | $106,000 | No Value Available |
Source: Pikes Peak REALTOR® Services
MLS Number: 2196586
APN: 62230-00-109
Disclaimer: Certain information contained herein is derived from information provided by parties other than Homes.com. All information provided is deemed reliable, but is not guaranteed to be accurate and should be independently verified.
![]() IDX information is provided exclusively for personal, non-commercial use, and may not be used for any purpose other than to identify prospective properties consumers may be interested in purchasing. Information is deemed reliable but not guaranteed.
IDX information is provided exclusively for personal, non-commercial use, and may not be used for any purpose other than to identify prospective properties consumers may be interested in purchasing. Information is deemed reliable but not guaranteed.
- 10409 Marshall Mesa Ct
- 10409 Crystal Lake Ct
- 4252 Horse Gulch Loop
- 4508 Captain Jack Ln
- 4261 Horse Gulch Loop
- 4272 Horse Gulch Loop
- 10636 Echo Canyon Dr
- 4008 Notch Trail
- 3718 Sky Rim Ct
- 4208 Notch Trail
- 10687 Hidden Brook Cir
- 9979 Rose Leaf Ct
- 3470 Daydreamer Dr
- 4661 Horse Gulch Loop
- 3410 Daydreamer Dr
- 4723 Portillo Place
- 3389 Sugar Pine Way
- 4754 Hanging Lake Cir
- 10880 Warm Sunshine Dr
- 10632 Leadville Creek Point
- 11020 Echo Canyon Dr
- 10271 Murmuring Pine Ct
- 4610 Nautilus Peak View
- 4946 Olympus Dr
- 5230 Janga Dr
- 9520 Antora Grove
- 3296 Greenmoor Ct
- 4433N Carefree
- 9246 Grand Cordera Pkwy
- 9170 Crowne Springs View
- 10945 Shade View
- 2555 Raywood View
- 10562 Domeykite View
- 2845 Freewood Point
- 10650 Sapphire Falls View
- 2213 Shady Aspen Dr
- 1551 Spring Water Point
- 8385 Freemantle Dr
- 11275 Nahcolite Point
- 11497 White Lotus Ln
