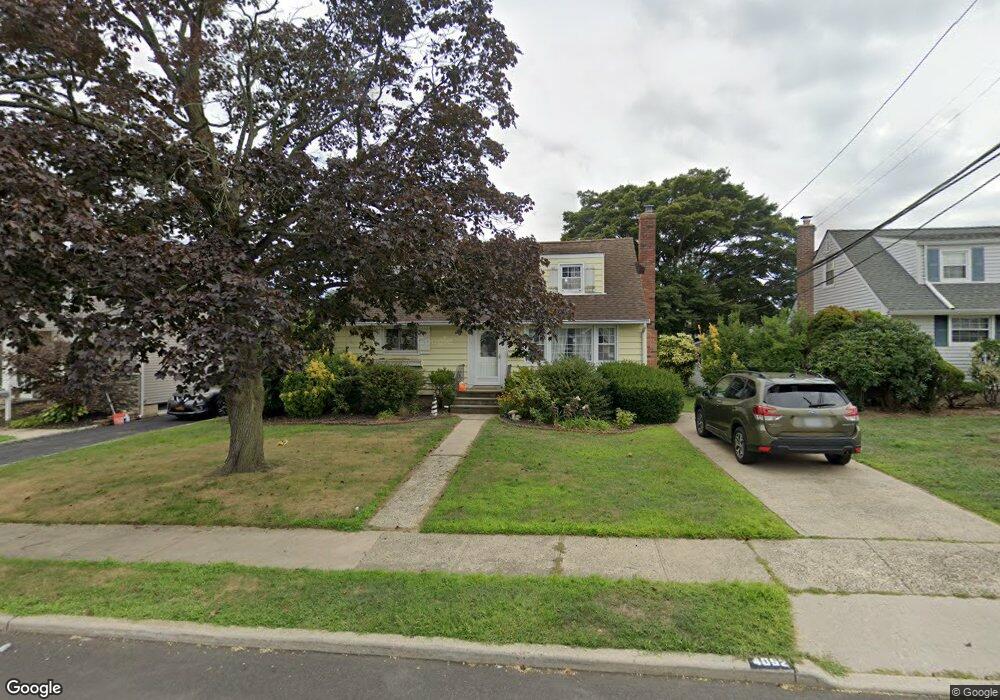
4052 Wicks Ave Seaford, NY 11783
Estimated Value: $642,000 - $736,272
4
Beds
2
Baths
1,260
Sq Ft
$547/Sq Ft
Est. Value
About This Home
This home is located at 4052 Wicks Ave, Seaford, NY 11783 and is currently estimated at $689,136, approximately $546 per square foot. 4052 Wicks Ave is a home located in Nassau County with nearby schools including East Broadway School, Jonas E. Salk Middle School, and Gen. Douglas MacArthur Senior High School.
Ownership History
Date
Name
Owned For
Owner Type
Purchase Details
Closed on
Mar 27, 2024
Sold by
Rosen Fran and Rosen Monte
Bought by
Rosen Andrew and Rosen Jenny
Current Estimated Value
Purchase Details
Closed on
May 31, 2017
Sold by
Rosen Andrew and Rosen Christina
Bought by
Rosen Fran and Rosen Andrew
Purchase Details
Closed on
Aug 27, 2015
Sold by
Dice Lynda and Carroll Laura
Bought by
Rosen Andrew and Rosen Christina
Home Financials for this Owner
Home Financials are based on the most recent Mortgage that was taken out on this home.
Original Mortgage
$300,000
Outstanding Balance
$235,142
Interest Rate
4.01%
Mortgage Type
New Conventional
Estimated Equity
$453,994
Create a Home Valuation Report for This Property
The Home Valuation Report is an in-depth analysis detailing your home's value as well as a comparison with similar homes in the area
Home Values in the Area
Average Home Value in this Area
Purchase History
| Date | Buyer | Sale Price | Title Company |
|---|---|---|---|
| Rosen Andrew | -- | New York Title Research Corp | |
| Rosen Andrew | -- | New York Title Research Corp | |
| Rosen Fran | -- | Land Bound Services Llc | |
| Rosen Fran | -- | Land Bound Services Llc | |
| Rosen Fran | -- | Land Bound Services Llc | |
| Rosen Andrew | $375,000 | Mkm Abstract Services Inc | |
| Rosen Andrew | $375,000 | Mkm Abstract Services Inc | |
| Rosen Andrew | $375,000 | Mkm Abstract Services Inc |
Source: Public Records
Mortgage History
| Date | Status | Borrower | Loan Amount |
|---|---|---|---|
| Open | Rosen Andrew | $300,000 | |
| Closed | Rosen Andrew | $300,000 |
Source: Public Records
Tax History Compared to Growth
Tax History
| Year | Tax Paid | Tax Assessment Tax Assessment Total Assessment is a certain percentage of the fair market value that is determined by local assessors to be the total taxable value of land and additions on the property. | Land | Improvement |
|---|---|---|---|---|
| 2025 | $13,250 | $420 | $238 | $182 |
| 2024 | $2,913 | $416 | $236 | $180 |
| 2023 | $12,480 | $441 | $251 | $190 |
| 2022 | $12,480 | $435 | $247 | $188 |
| 2021 | $16,329 | $438 | $234 | $204 |
| 2020 | $11,963 | $605 | $565 | $40 |
| 2019 | $12,343 | $563 | $547 | $16 |
| 2018 | $10,919 | $581 | $0 | $0 |
| 2017 | $8,516 | $581 | $536 | $45 |
| 2016 | $12,141 | $612 | $494 | $118 |
| 2015 | $1,464 | $612 | $494 | $118 |
| 2014 | $1,464 | $612 | $494 | $118 |
| 2013 | $1,570 | $700 | $565 | $135 |
Source: Public Records
Map
Nearby Homes
- 4038 Meadow Ln
- 4090 Sherrey Ct
- 1144 Greenway Ct
- 4057 Eve Dr
- 7 Crocus Dr
- 344 N Hickory St
- 3 Rutland Rd
- 558 N Hawthorne St
- 3975 Anne Dr
- 598 N Suffolk Ave
- 530 N Hawthorne St
- 31 Poplar St
- 530 N Oak St
- 41 Poplar St
- 4030 Jerusalem Ave Unit 1B
- 3773 Arthur Ave W
- 3914 Jerusalem Ave
- 282 N Oak St
- 712 Pineneck Rd
- 1427 Washington Ave
- 4046 Wicks Ave
- 4058 Wicks Ave
- 4040 Wicks Ave
- 4051 Howard Ave
- 4045 Howard Ave
- 1070 Jerome St
- 4057 Howard Ave
- 1080 Jerome St
- 4057 Wicks Ave
- 4039 Howard Ave
- 4045 Wicks Ave
- 4034 Wicks Ave
- 4063 Wicks Ave
- 1090 Jerome St
- 4039 Wicks Ave
- 4053 Howard Ave
- 4069 Wicks Ave
- 4028 Wicks Ave
- 4033 Wicks Ave
- 4027 Howard Ave