Estimated Value: $245,000 - $274,000
3
Beds
1
Bath
1,624
Sq Ft
$159/Sq Ft
Est. Value
About This Home
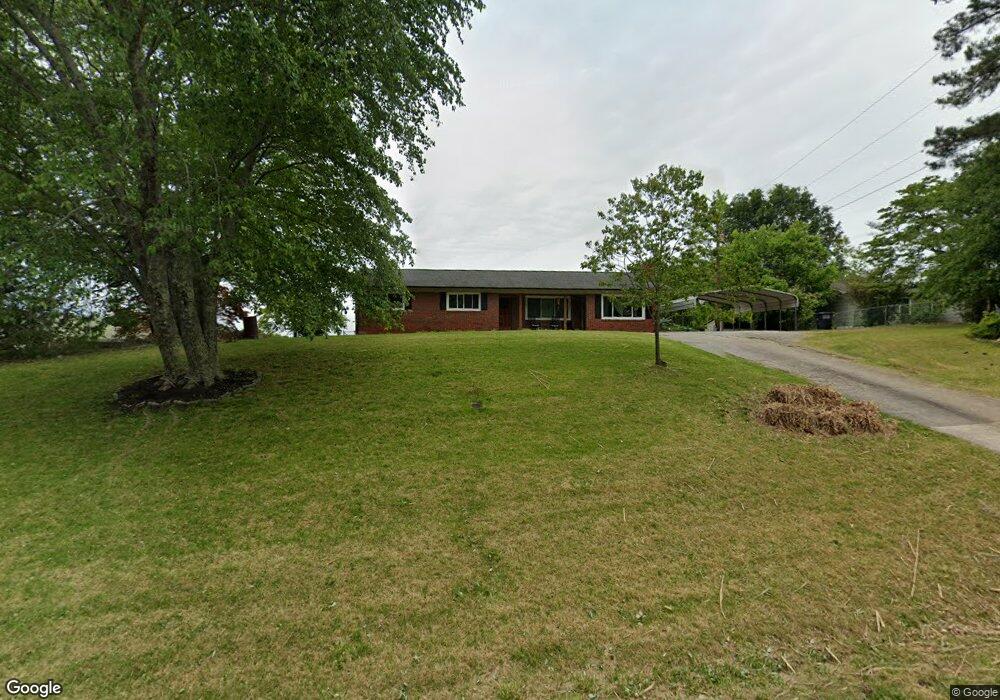
This home is located at 4053 Gainesville Hwy, Alto, GA 30510 and is currently estimated at $258,417, approximately $159 per square foot. 4053 Gainesville Hwy is a home located in Habersham County with nearby schools including Baldwin Elementary School, South Habersham Middle School, and Habersham Success Academy.
Ownership History
Date
Name
Owned For
Owner Type
Purchase Details
Closed on
Aug 1, 2017
Sold by
Weber Tiimothy Ryan
Bought by
Weber Timothy Ryan and Weber Stephanie
Current Estimated Value
Home Financials for this Owner
Home Financials are based on the most recent Mortgage that was taken out on this home.
Original Mortgage
$119,191
Outstanding Balance
$99,456
Interest Rate
3.96%
Mortgage Type
New Conventional
Estimated Equity
$158,961
Purchase Details
Closed on
Mar 29, 2012
Sold by
Wright Floyd Weldon
Bought by
Wright James Luther and Wright Carvin Bruce
Home Financials for this Owner
Home Financials are based on the most recent Mortgage that was taken out on this home.
Original Mortgage
$81,632
Interest Rate
3.95%
Mortgage Type
New Conventional
Create a Home Valuation Report for This Property
The Home Valuation Report is an in-depth analysis detailing your home's value as well as a comparison with similar homes in the area
Home Values in the Area
Average Home Value in this Area
Purchase History
| Date | Buyer | Sale Price | Title Company |
|---|---|---|---|
| Weber Timothy Ryan | -- | -- | |
| Weber Timothy Ryan | $118,000 | -- | |
| Wright James Luther | -- | -- | |
| Wright Kevin Theo | $80,000 | -- |
Source: Public Records
Mortgage History
| Date | Status | Borrower | Loan Amount |
|---|---|---|---|
| Open | Weber Timothy Ryan | $119,191 | |
| Closed | Weber Timothy Ryan | $119,191 | |
| Previous Owner | Wright Kevin Theo | $81,632 |
Source: Public Records
Tax History Compared to Growth
Tax History
| Year | Tax Paid | Tax Assessment Tax Assessment Total Assessment is a certain percentage of the fair market value that is determined by local assessors to be the total taxable value of land and additions on the property. | Land | Improvement |
|---|---|---|---|---|
| 2025 | $1,862 | $88,893 | $8,000 | $80,893 |
| 2024 | -- | $79,548 | $8,000 | $71,548 |
| 2023 | $842 | $67,312 | $8,000 | $59,312 |
| 2022 | $1,212 | $58,300 | $8,000 | $50,300 |
| 2021 | $1,130 | $51,060 | $6,000 | $45,060 |
| 2020 | $1,088 | $44,848 | $6,000 | $38,848 |
| 2019 | $1,089 | $44,848 | $6,000 | $38,848 |
| 2018 | $1,082 | $44,848 | $6,000 | $38,848 |
| 2017 | $864 | $32,156 | $3,600 | $28,556 |
| 2016 | $838 | $80,390 | $3,600 | $28,556 |
| 2015 | $829 | $80,390 | $3,600 | $28,556 |
| 2014 | $830 | $79,050 | $3,600 | $28,020 |
| 2013 | -- | $31,620 | $3,600 | $28,020 |
Source: Public Records
Map
Nearby Homes
- 135 Oak Terrace Dr
- 117 Oak Terrace Dr
- 603 Nix Rd
- 130 E Railroad Ave
- 2484 Apple Pie Ridge Rd Unit 11 ACRES
- 2154 Apple Pie Ridge Rd
- 3073 Gainesville Hwy
- 3568 State Route 365
- 933 Alto Mud Creek Rd
- 39 Planters Creek Dr
- 41 Planters Creek Dr
- 140 Highland Pointe Dr
- 738 Wilbanks Rd
- 1085 Smokey Rd
- 0 State Route 365 Unit 10496178
- 0 State Route 365 Unit 10496183
- 179 Sunset Oaks Dr
- 0 Planters Pointe Dr Unit 10636110
- 0 Planters Pointe Ln Unit 10620249
- 0 Planters Creek Dr Unit Lot 34 CM1024458
- 4031 Gainesville Hwy
- 4083 Gainesville Hwy
- 128 Alto St
- 4031 Gainesville Hwy
- 792 Wheeler Cir
- 176 Alto St
- 0 Alto St Unit 8478708
- 0 Alto St Unit 7321141
- 0 Alto St
- 135 Alto St
- 214 Alto St
- 125 Alto St
- 776 Wheeler Cir
- 173 Alto St
- 111 Alto St
- 150 Wheeler St
- 243 Alto St
- 168 Wheeler Cir
- 260 Alto St
- 760 Wheeler Cir