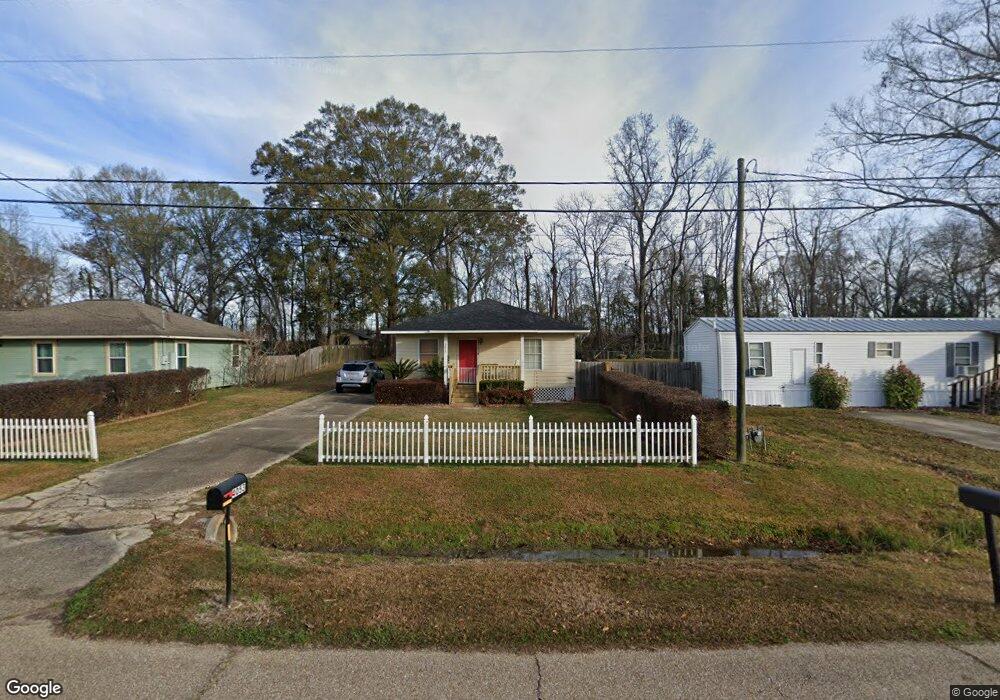
4053 N Row Ave Zachary, LA 70791
Estimated Value: $143,939 - $179,000
2
Beds
2
Baths
1,028
Sq Ft
$155/Sq Ft
Est. Value
About This Home
This home is located at 4053 N Row Ave, Zachary, LA 70791 and is currently estimated at $159,235, approximately $154 per square foot. 4053 N Row Ave is a home located in East Baton Rouge Parish with nearby schools including Rollins Place Elementary School, Northwestern Elementary School, and Zachary Elementary School.
Ownership History
Date
Name
Owned For
Owner Type
Purchase Details
Closed on
Sep 29, 2006
Sold by
Day Morris D
Bought by
Womack Brett A
Current Estimated Value
Home Financials for this Owner
Home Financials are based on the most recent Mortgage that was taken out on this home.
Original Mortgage
$107,000
Outstanding Balance
$63,884
Interest Rate
6.47%
Mortgage Type
New Conventional
Estimated Equity
$95,351
Purchase Details
Closed on
Jan 17, 2006
Sold by
Pitre Cynthia R
Bought by
Day Morris D
Home Financials for this Owner
Home Financials are based on the most recent Mortgage that was taken out on this home.
Original Mortgage
$50,000
Interest Rate
6.25%
Mortgage Type
New Conventional
Purchase Details
Closed on
Jun 28, 2000
Sold by
Hud
Bought by
Pitre Cynthia Renee
Home Financials for this Owner
Home Financials are based on the most recent Mortgage that was taken out on this home.
Original Mortgage
$28,500
Interest Rate
8.66%
Purchase Details
Closed on
Jan 21, 2000
Sold by
Tanner Timothy Troy
Bought by
Fleet Mtg Corp and Fleet Real Estate Funding Corp
Create a Home Valuation Report for This Property
The Home Valuation Report is an in-depth analysis detailing your home's value as well as a comparison with similar homes in the area
Home Values in the Area
Average Home Value in this Area
Purchase History
| Date | Buyer | Sale Price | Title Company |
|---|---|---|---|
| Womack Brett A | $107,000 | -- | |
| Day Morris D | $42,500 | -- | |
| Pitre Cynthia Renee | $30,000 | -- | |
| Fleet Mtg Corp | $49,000 | -- |
Source: Public Records
Mortgage History
| Date | Status | Borrower | Loan Amount |
|---|---|---|---|
| Open | Womack Brett A | $107,000 | |
| Previous Owner | Day Morris D | $50,000 | |
| Previous Owner | Pitre Cynthia Renee | $28,500 |
Source: Public Records
Tax History Compared to Growth
Tax History
| Year | Tax Paid | Tax Assessment Tax Assessment Total Assessment is a certain percentage of the fair market value that is determined by local assessors to be the total taxable value of land and additions on the property. | Land | Improvement |
|---|---|---|---|---|
| 2024 | $818 | $13,552 | $1,232 | $12,320 |
| 2023 | $818 | $12,100 | $1,100 | $11,000 |
| 2022 | $1,592 | $12,100 | $1,100 | $11,000 |
| 2021 | $1,592 | $12,100 | $1,100 | $11,000 |
| 2020 | $1,583 | $12,100 | $1,100 | $11,000 |
| 2019 | $1,576 | $11,000 | $1,000 | $10,000 |
| 2018 | $1,581 | $11,000 | $1,000 | $10,000 |
| 2017 | $1,581 | $11,000 | $1,000 | $10,000 |
| 2016 | $515 | $11,000 | $1,000 | $10,000 |
| 2015 | $473 | $10,700 | $1,000 | $9,700 |
| 2014 | $471 | $10,700 | $1,000 | $9,700 |
| 2013 | -- | $10,700 | $1,000 | $9,700 |
Source: Public Records
Map
Nearby Homes
- 3981 N Row Ave
- 3182 S Vernon Dr
- 3325 Safer Dr
- 8301 Pin Oak Dr
- 8272 Oakley Dr
- LOT A-2-A Yardley Dr
- 1218 Mills Pointe Dr
- 2462 Rue Lavande
- 102 Rue Fraise
- 81 Rue Fraise
- 91 Rue Fraise
- 97 Rue Fraise
- 100 Rue Fraise
- 99 Rue Fraise
- 101 Rue Fraise
- 98 Rue Fraise
- 86 Rue Fraise
- 83 Rue Fraise
- 82 Rue Fraise
- 85 Rue Fraise
- 4043 N Row Ave
- 4063 N Row Ave
- 4033 N Row Ave
- 4125 N Row Ave
- 4023 N Row Ave
- 4044 N Row Ave
- 4013 N Row Ave
- 4130 N Row Ave
- 4034 N Row Ave
- 4155 N Row Ave
- 3971 N Row Ave
- 23453 Chuck Wagon Dr
- 4165 N Row Ave
- 23449 Chuck Wagon Dr
- 3951 N Row Ave
- 3998 N Row Ave
- 23439 Chuck Wagon Dr
- 3941 N Row Ave
- 23528 Chuck Wagon Dr
- 3931 N Row Ave