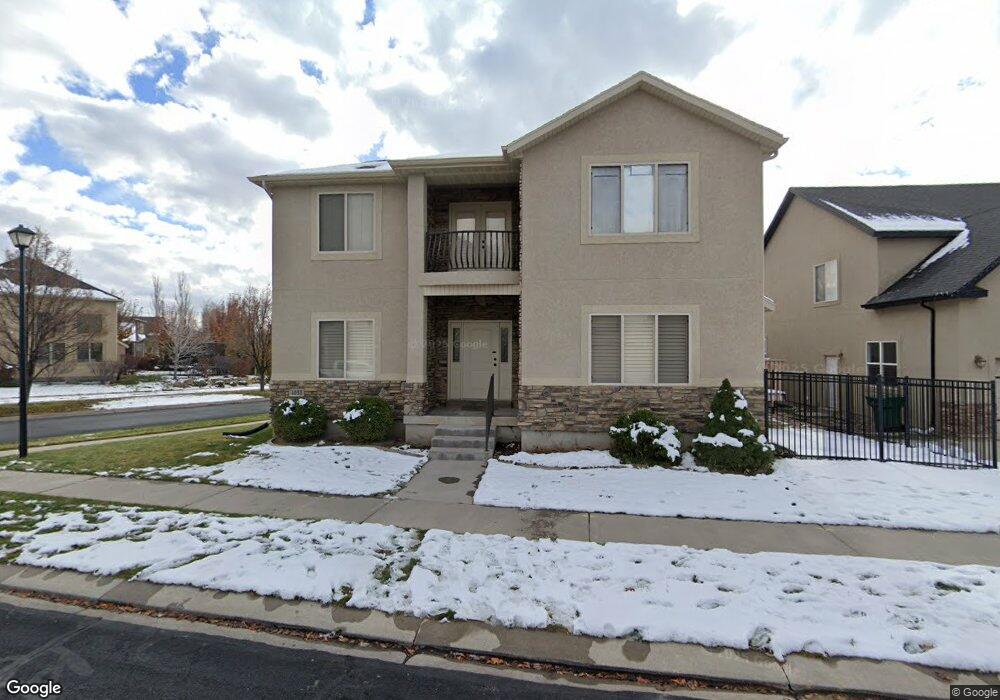
4053 Shinnecock Unit 19 C Pleasant Grove, UT 84062
Estimated Value: $672,000 - $731,000
3
Beds
3
Baths
2,558
Sq Ft
$272/Sq Ft
Est. Value
About This Home
This home is located at 4053 Shinnecock Unit 19 C, Pleasant Grove, UT 84062 and is currently estimated at $696,297, approximately $272 per square foot. 4053 Shinnecock Unit 19 C is a home located in Utah County with nearby schools including Cedar Ridge Elementary School, Mountain Ridge Junior High School, and Lone Peak High School.
Ownership History
Date
Name
Owned For
Owner Type
Purchase Details
Closed on
Sep 24, 2024
Sold by
Staton Forest Scott
Bought by
Favreau Marc and Favreau Jan
Current Estimated Value
Home Financials for this Owner
Home Financials are based on the most recent Mortgage that was taken out on this home.
Original Mortgage
$509,200
Outstanding Balance
$503,987
Interest Rate
6.49%
Mortgage Type
New Conventional
Estimated Equity
$192,310
Purchase Details
Closed on
Aug 18, 2006
Sold by
Jenkins Thomas R
Bought by
Staton Forest Scott and Staton Laurie Sue
Purchase Details
Closed on
Oct 6, 2005
Sold by
Campbell Bruce
Bought by
Jenkins Thomas R
Home Financials for this Owner
Home Financials are based on the most recent Mortgage that was taken out on this home.
Original Mortgage
$45,000
Interest Rate
5.67%
Mortgage Type
Unknown
Purchase Details
Closed on
Jun 23, 2005
Sold by
Dakota Homes Inc
Bought by
Campbell Bruce
Create a Home Valuation Report for This Property
The Home Valuation Report is an in-depth analysis detailing your home's value as well as a comparison with similar homes in the area
Home Values in the Area
Average Home Value in this Area
Purchase History
| Date | Buyer | Sale Price | Title Company |
|---|---|---|---|
| Favreau Marc | -- | Inwest Title | |
| Staton Forest Scott | -- | First American Title Agency | |
| Jenkins Thomas R | -- | First American Title Agency | |
| Campbell Bruce | -- | Meridian Title Company |
Source: Public Records
Mortgage History
| Date | Status | Borrower | Loan Amount |
|---|---|---|---|
| Open | Favreau Marc | $509,200 | |
| Previous Owner | Jenkins Thomas R | $45,000 | |
| Previous Owner | Jenkins Thomas R | $232,500 |
Source: Public Records
Tax History Compared to Growth
Tax History
| Year | Tax Paid | Tax Assessment Tax Assessment Total Assessment is a certain percentage of the fair market value that is determined by local assessors to be the total taxable value of land and additions on the property. | Land | Improvement |
|---|---|---|---|---|
| 2025 | $2,654 | $347,050 | $202,300 | $428,700 |
| 2024 | $2,654 | $314,325 | $0 | $0 |
| 2023 | $2,496 | $317,570 | $0 | $0 |
| 2022 | $2,631 | $326,975 | $0 | $0 |
| 2021 | $2,382 | $440,900 | $122,800 | $318,100 |
| 2020 | $2,216 | $400,300 | $113,700 | $286,600 |
| 2019 | $2,116 | $396,900 | $113,700 | $283,200 |
| 2018 | $1,999 | $353,400 | $107,100 | $246,300 |
| 2017 | $1,998 | $188,815 | $0 | $0 |
| 2016 | $1,908 | $167,750 | $0 | $0 |
| 2015 | $1,972 | $164,065 | $0 | $0 |
| 2014 | $1,938 | $160,105 | $0 | $0 |
Source: Public Records
Map
Nearby Homes
- 4084 W Shinnecock
- 10795 N La Costa
- 10587 N Avalon St
- 10514 N Doral Dr
- 10412 N Bayhill Dr
- 4292 W Joshua Ln
- 10456 N Morgan Blvd
- 11197 N Park Dr
- 10468 N Sage Vista Ln
- 10448 Sage Vista Ln
- 10207 N Cottonwood Dr
- 4198 W Sage Rd N
- 10535 Janie Ln
- 3870 Mountaintop Cir
- 1263 E Chapman Ct
- 1292 E 810 S
- 3851 W Mountaintop Cir Unit 5
- 860 Stonehedge Rd
- 9900 N Meadow Dr
- 10052 N Marigold Ln
- 4053 Shinnecock
- 4063 Shinnecock
- 4063 W Shinnecock
- 4022 Shinnecock Unit C7
- 4072 W Hayes Cir Unit 12 C
- 4072 W Hayes Cir
- 4072 Hayes Cir
- 4073 Shinnecock
- 4073 W Shinnecock
- 10743 N Shinnecock Unit 18 C
- 10743 Shinnecock
- 4054 Shinnecock Unit 107
- 4042 Shinnecock Unit 107
- 4054 W Shinnecock Unit 35C
- 4054 W Shinnecock
- 4042 W Shinnecock
- 4068 Shinnecock Unit 107
- 4036 Shinnecock Unit 107
- 10724 N Hayes Cir Unit 11 C
- 10724 N Hayes Cir