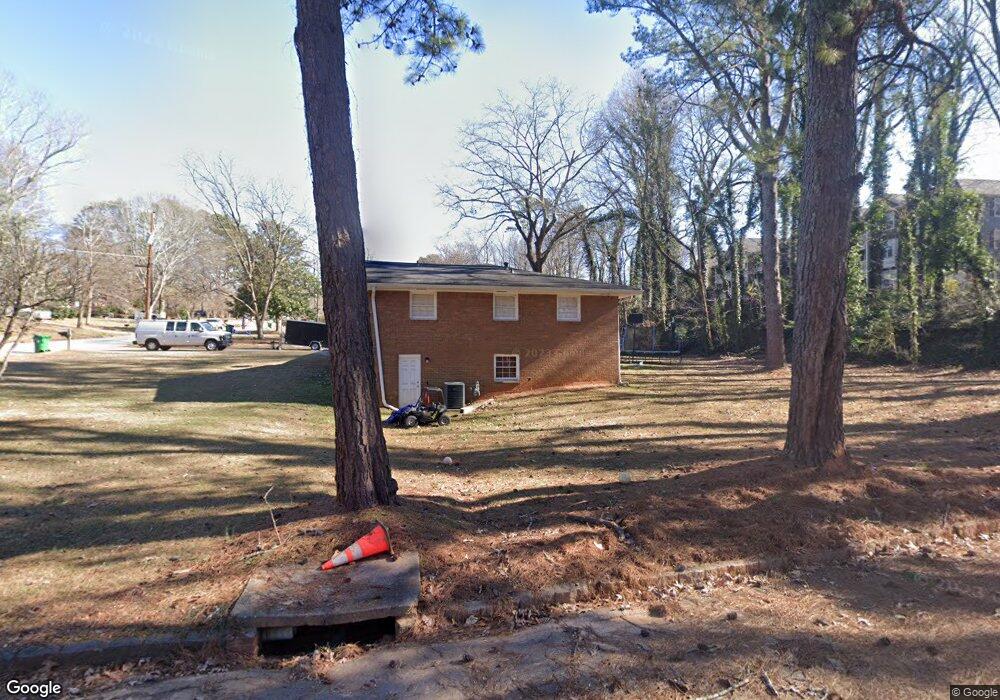
4053 Spring Meadow Rd Tucker, GA 30084
Pittsburg NeighborhoodEstimated Value: $359,183 - $394,000
3
Beds
2
Baths
1,551
Sq Ft
$246/Sq Ft
Est. Value
About This Home
This home is located at 4053 Spring Meadow Rd, Tucker, GA 30084 and is currently estimated at $380,796, approximately $245 per square foot. 4053 Spring Meadow Rd is a home located in DeKalb County with nearby schools including Livsey Elementary School, Tucker Middle School, and Tucker High School.
Ownership History
Date
Name
Owned For
Owner Type
Purchase Details
Closed on
Sep 6, 2017
Sold by
Not Provided
Bought by
2017 1 Ih Borrower Lp
Current Estimated Value
Purchase Details
Closed on
May 30, 2014
Sold by
Thr Georgia Lp
Bought by
2014 1 Ih Borrower Lp
Purchase Details
Closed on
Jan 25, 2013
Sold by
Federal National Mortgage Association
Bought by
Thr Georgia Lp
Purchase Details
Closed on
Jul 3, 2012
Sold by
Bank Of America Na
Bought by
Federal National Mtg Associati
Purchase Details
Closed on
Jun 6, 2003
Sold by
Leonard Richard
Bought by
Ramos Aleida
Purchase Details
Closed on
Dec 2, 2002
Sold by
Jackson Steven R
Bought by
Jackson Richard L
Purchase Details
Closed on
Sep 27, 2001
Sold by
Jackson Richard L
Bought by
Jackson Steven R
Create a Home Valuation Report for This Property
The Home Valuation Report is an in-depth analysis detailing your home's value as well as a comparison with similar homes in the area
Home Values in the Area
Average Home Value in this Area
Purchase History
| Date | Buyer | Sale Price | Title Company |
|---|---|---|---|
| 2017 1 Ih Borrower Lp | -- | -- | |
| 2014 1 Ih Borrower Lp | -- | -- | |
| Thr Georgia Lp | $99,900 | -- | |
| Federal National Mtg Associati | $120,071 | -- | |
| Bank Of America Na | $120,071 | -- | |
| Ramos Aleida | $152,900 | -- | |
| Jackson Richard L | -- | -- | |
| Jackson Steven R | -- | -- |
Source: Public Records
Tax History Compared to Growth
Tax History
| Year | Tax Paid | Tax Assessment Tax Assessment Total Assessment is a certain percentage of the fair market value that is determined by local assessors to be the total taxable value of land and additions on the property. | Land | Improvement |
|---|---|---|---|---|
| 2025 | $6,095 | $128,800 | $24,000 | $104,800 |
| 2024 | $6,096 | $128,800 | $24,000 | $104,800 |
| 2023 | $6,096 | $119,040 | $24,000 | $95,040 |
| 2022 | $4,829 | $101,840 | $24,000 | $77,840 |
| 2021 | $4,095 | $85,120 | $23,834 | $61,286 |
| 2020 | $4,095 | $85,120 | $23,834 | $61,286 |
| 2019 | $2,966 | $85,120 | $24,000 | $61,120 |
| 2018 | $2,990 | $59,400 | $19,008 | $40,392 |
| 2017 | $2,978 | $59,400 | $19,008 | $40,392 |
| 2016 | $2,984 | $59,400 | $18,880 | $40,520 |
| 2014 | $2,154 | $39,628 | $14,246 | $25,382 |
Source: Public Records
Map
Nearby Homes
- 328 Bentley Place
- 225 Bentley Place
- 434 Bentley Place
- 533 Bentley Place
- 4075 Woodridge Way
- 5011 Woodridge Way
- 5031 Woodridge Way
- 3274 Enfield Ct
- 4005 Woodridge Way
- 5068 Woodridge Way
- 3987 Woodridge Way
- 3991 Woodridge Way
- 5081 Woodridge Way
- 4125 Spring Valley Cir Unit 7
- 3160 Shadow Walk Ln
- 3828 Woodridge Way
- 3923 Woodridge Way
- 4053 Spring Meadow Rd
- 4061 Spring Meadow Rd
- 133 Bentley Place
- 113 Bentley Place
- 113 Bentley Place Unit 414
- 123 Bentley Place
- 124 Bentley Place
- 131 Bentley Place Unit 131
- 121 Bentley Place
- 134 Bentley Place
- 114 Bentley Place Unit 114
- 111 Bentley Place
- 3278 Spring Meadow Ct
- 4052 Spring Meadow Rd
- 4069 Spring Meadow Rd
- 132 Bentley Place
- 122 Bentley Place
- 112 Bentley Place
- 137 Bentley Place
- 137 Bentley Place Unit 137