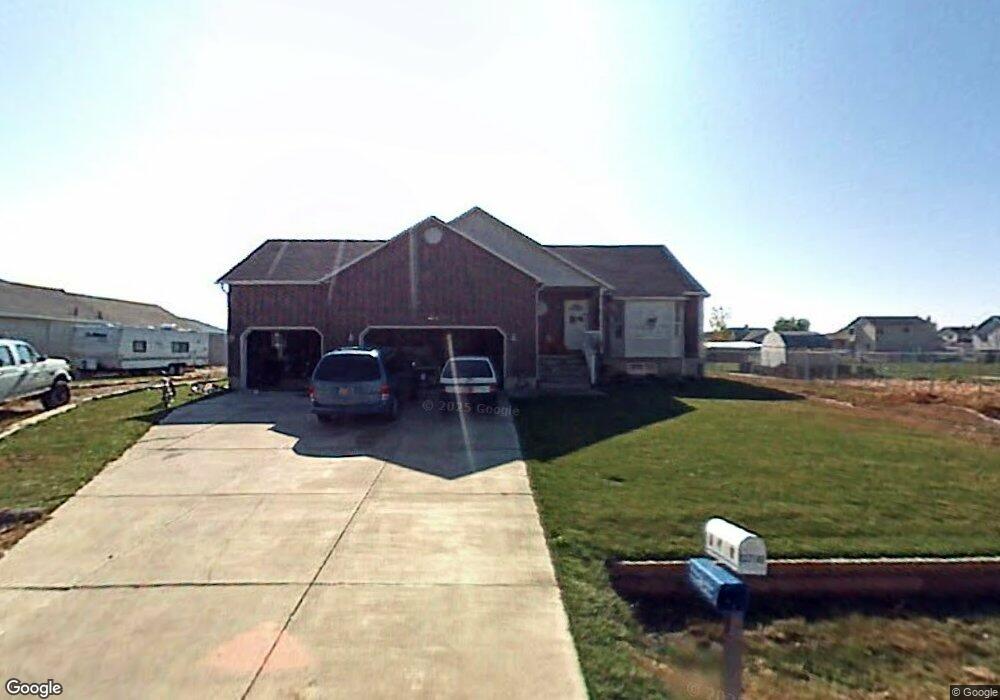
4053 W 4450 S West Haven, UT 84401
Estimated Value: $520,000 - $629,000
5
Beds
3
Baths
2,352
Sq Ft
$245/Sq Ft
Est. Value
About This Home
This home is located at 4053 W 4450 S, West Haven, UT 84401 and is currently estimated at $576,976, approximately $245 per square foot. 4053 W 4450 S is a home located in Weber County with nearby schools including West Haven School, Sand Ridge Junior High School, and Roy High School.
Ownership History
Date
Name
Owned For
Owner Type
Purchase Details
Closed on
Feb 4, 2009
Sold by
Cozair Eric D and Coziar Shari L
Bought by
Coziar Eric
Current Estimated Value
Home Financials for this Owner
Home Financials are based on the most recent Mortgage that was taken out on this home.
Original Mortgage
$184,500
Outstanding Balance
$115,236
Interest Rate
5.04%
Mortgage Type
New Conventional
Estimated Equity
$461,740
Purchase Details
Closed on
Mar 24, 2003
Sold by
Hutchens Laurie P
Bought by
Coziar Eric D and Coziar Shari L
Home Financials for this Owner
Home Financials are based on the most recent Mortgage that was taken out on this home.
Original Mortgage
$123,000
Interest Rate
5.82%
Mortgage Type
Purchase Money Mortgage
Purchase Details
Closed on
Oct 3, 1996
Sold by
Peterson Melvin L and Sessions Scott C
Bought by
Hutchens David A and Hutchens Laurie P
Home Financials for this Owner
Home Financials are based on the most recent Mortgage that was taken out on this home.
Original Mortgage
$117,600
Interest Rate
8.1%
Create a Home Valuation Report for This Property
The Home Valuation Report is an in-depth analysis detailing your home's value as well as a comparison with similar homes in the area
Home Values in the Area
Average Home Value in this Area
Purchase History
| Date | Buyer | Sale Price | Title Company |
|---|---|---|---|
| Coziar Eric | -- | Utah Commercial Title | |
| Coziar Eric D | -- | Founders Title | |
| Hutchens David A | -- | Bonneville Title |
Source: Public Records
Mortgage History
| Date | Status | Borrower | Loan Amount |
|---|---|---|---|
| Open | Coziar Eric | $184,500 | |
| Closed | Coziar Eric D | $123,000 | |
| Previous Owner | Hutchens David A | $117,600 |
Source: Public Records
Tax History Compared to Growth
Tax History
| Year | Tax Paid | Tax Assessment Tax Assessment Total Assessment is a certain percentage of the fair market value that is determined by local assessors to be the total taxable value of land and additions on the property. | Land | Improvement |
|---|---|---|---|---|
| 2025 | $3,658 | $542,996 | $174,169 | $368,827 |
| 2024 | $3,477 | $293,699 | $95,792 | $197,907 |
| 2023 | $3,331 | $283,250 | $95,793 | $187,457 |
| 2022 | $3,410 | $299,750 | $95,793 | $203,957 |
| 2021 | $2,947 | $429,000 | $88,237 | $340,763 |
| 2020 | $2,887 | $395,000 | $73,393 | $321,607 |
| 2019 | $2,733 | $358,000 | $75,280 | $282,720 |
| 2018 | $2,625 | $334,000 | $61,228 | $272,772 |
| 2017 | $2,373 | $283,000 | $63,481 | $219,519 |
| 2016 | $2,089 | $135,193 | $28,266 | $106,927 |
| 2015 | $2,025 | $130,101 | $28,266 | $101,835 |
| 2014 | $1,863 | $117,595 | $28,266 | $89,329 |
Source: Public Records
Map
Nearby Homes
- 4024 W 4650 S
- 4094 W 4700 S
- 4097 W 4750 S
- 3692 W 4625 S
- Villages Townhome Plan at Green Farm - Villages
- 4756 S 4300 W
- 4106 W 4875 S
- 3652 W 4625 S
- 4141 W 4875 S
- 3632 W 4650 S
- 3671 W 4700 S
- 3627 W 4650 S
- 4890 S 4075 W
- 4080 W 4000 S
- 3610 W 4475 S
- 3984 W 4000 S
- 4990 S 4075 W
- 4021 W 5000 S
- 5013 S 4150 W
- 4218 W 5050 S