Estimated Value: $553,000 - $619,302
5
Beds
5
Baths
3,868
Sq Ft
$152/Sq Ft
Est. Value
About This Home
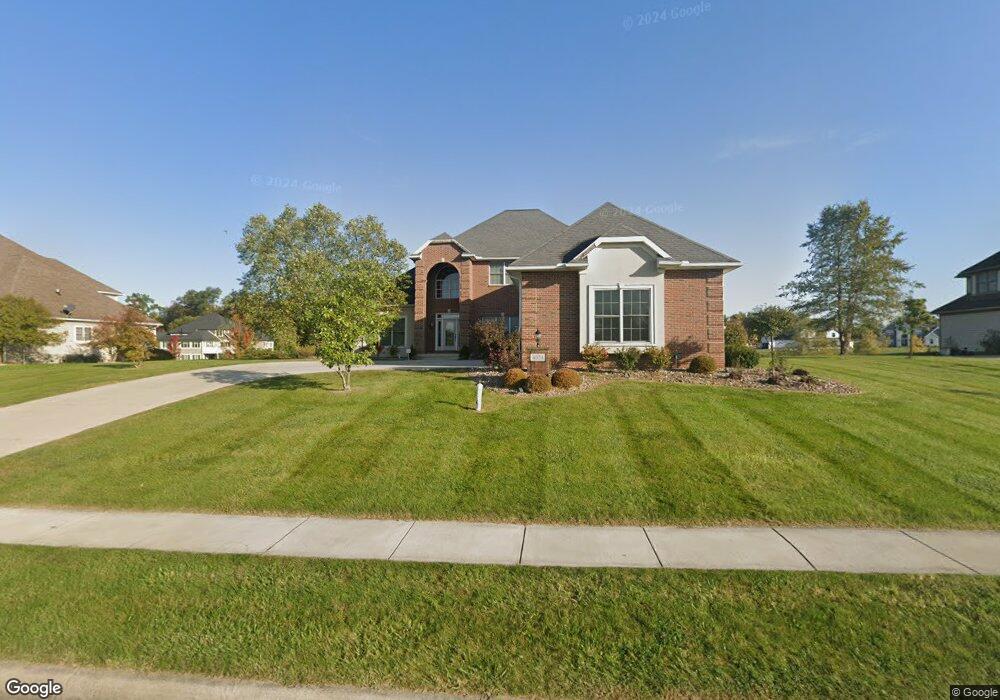
This home is located at 4054 Magnolia St, Lima, OH 45806 and is currently estimated at $586,767, approximately $151 per square foot. 4054 Magnolia St is a home located in Allen County with nearby schools including Maplewood Elementary School, Elmwood Elementary School, and Shawnee Middle School.
Ownership History
Date
Name
Owned For
Owner Type
Purchase Details
Closed on
Sep 27, 2024
Sold by
Ambalavanan Surianarayanan and Ambalavanan Santhosh K
Bought by
Surianarayanan Ambalavanan and Surianarayanan Santhosh Kumari
Current Estimated Value
Purchase Details
Closed on
Mar 2, 2009
Sold by
Tsb Inc
Bought by
Ambalavanan Surianarayanan and Ambalavanan Santhosh K
Home Financials for this Owner
Home Financials are based on the most recent Mortgage that was taken out on this home.
Original Mortgage
$417,000
Interest Rate
4.91%
Mortgage Type
Purchase Money Mortgage
Purchase Details
Closed on
Sep 30, 2008
Sold by
Richard L & Donna E Williams Family Lp
Bought by
Tsb Inc
Home Financials for this Owner
Home Financials are based on the most recent Mortgage that was taken out on this home.
Original Mortgage
$409,500
Interest Rate
6.5%
Mortgage Type
Purchase Money Mortgage
Create a Home Valuation Report for This Property
The Home Valuation Report is an in-depth analysis detailing your home's value as well as a comparison with similar homes in the area
Home Values in the Area
Average Home Value in this Area
Purchase History
| Date | Buyer | Sale Price | Title Company |
|---|---|---|---|
| Surianarayanan Ambalavanan | -- | None Listed On Document | |
| Ambalavanan Surianarayanan | $575,000 | Attorney | |
| Tsb Inc | $53,000 | Attorney |
Source: Public Records
Mortgage History
| Date | Status | Borrower | Loan Amount |
|---|---|---|---|
| Previous Owner | Ambalavanan Surianarayanan | $417,000 | |
| Previous Owner | Tsb Inc | $409,500 |
Source: Public Records
Tax History Compared to Growth
Tax History
| Year | Tax Paid | Tax Assessment Tax Assessment Total Assessment is a certain percentage of the fair market value that is determined by local assessors to be the total taxable value of land and additions on the property. | Land | Improvement |
|---|---|---|---|---|
| 2024 | $9,058 | $185,820 | $18,200 | $167,620 |
| 2023 | $9,784 | $176,970 | $17,330 | $159,640 |
| 2022 | $9,845 | $176,970 | $17,330 | $159,640 |
| 2021 | $9,890 | $176,970 | $17,330 | $159,640 |
| 2020 | $7,896 | $163,560 | $16,420 | $147,140 |
| 2019 | $7,896 | $163,560 | $16,420 | $147,140 |
| 2018 | $7,819 | $163,560 | $16,420 | $147,140 |
| 2017 | $7,773 | $156,560 | $16,420 | $140,140 |
| 2016 | $7,700 | $156,560 | $16,420 | $140,140 |
| 2015 | $8,862 | $156,560 | $16,420 | $140,140 |
| 2014 | $8,862 | $178,050 | $15,330 | $162,720 |
| 2013 | $8,709 | $178,050 | $15,330 | $162,720 |
Source: Public Records
Map
Nearby Homes
- 4039 Magnolia
- 4268 Blue Spruce Ln
- 3031 Yoakam Rd
- 4475 Wintergreen Dr
- 3495 Woodhaven Ln
- 3523 Woodhaven Ln
- 4211 Fort Amanda Rd
- 3650 Redbud Ln
- 1911 Wonderlick Rd
- 3680 Yoakam Rd
- 3648 Hiawatha Trail
- 2227 Seneca Dr
- 2632 Alexandria Dr
- 2320 London Dr
- 2517 Hall Dr
- 3220 Fort Amanda Rd
- 1624 Pro Dr
- 2975 Zurmehly Rd
- 3410 Greens Rd
- 0 Colonial Ln
- 4054 Magnolia Ln
- 4046 Magnolia Ln
- 4046 Magnolia St
- 4068 Magnolia Ln
- 4068 Magnolia St
- 4053 Cypress Dr
- 4053 Cypress Ave
- 4076 Magnolia
- 4038 Magnolia
- 4063 Magnolia
- 4045 Magnolia
- 4045 Cypress Ave
- 4061 Cypress Ave
- 4031 Cypress Ave
- 4075 Cypress Ave
- 4084 Magnolia St
- 4084 Magnolia Ln
- 0000 Cypress Ave
- 0 Cypress Ave
- 4085 Magnolia