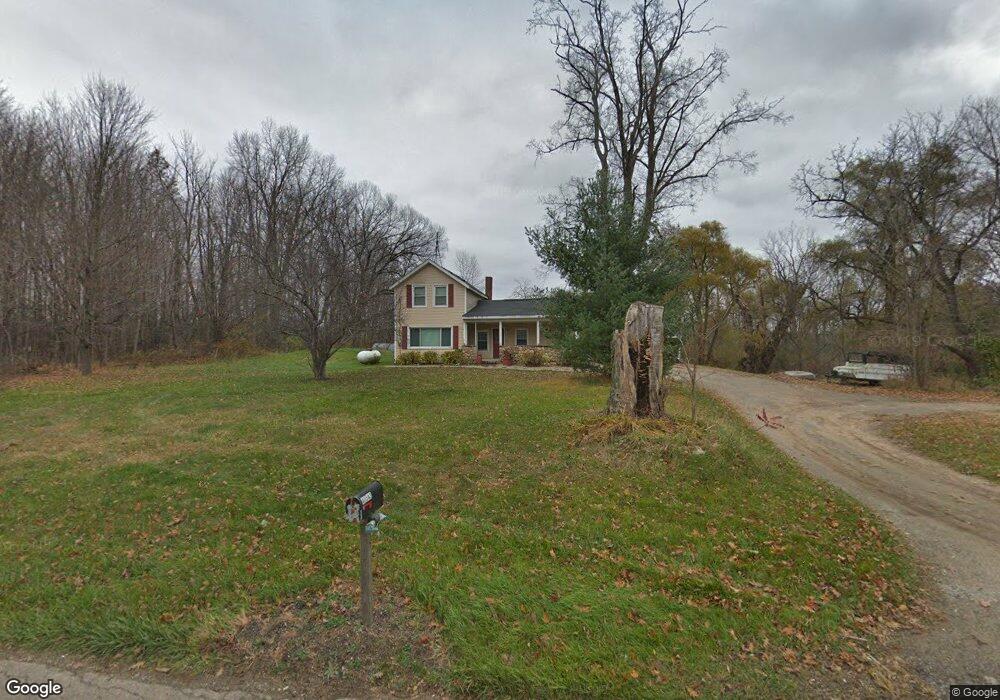
40543 M 40 Paw Paw, MI 49079
Estimated Value: $232,000 - $331,000
--
Bed
--
Bath
1,998
Sq Ft
$134/Sq Ft
Est. Value
About This Home
This home is located at 40543 M 40, Paw Paw, MI 49079 and is currently estimated at $268,720, approximately $134 per square foot. 40543 M 40 is a home located in Van Buren County with nearby schools including Paw Paw Early Elementary School, Paw Paw Later Elementary School, and Paw Paw Middle School.
Ownership History
Date
Name
Owned For
Owner Type
Purchase Details
Closed on
Feb 6, 2023
Sold by
Flick Scott and Flick Sonya
Bought by
Flick Scott and Flick Kayla Marie
Current Estimated Value
Purchase Details
Closed on
Feb 28, 2005
Sold by
Fisher Adolph L and Fisher Dorothy F
Bought by
Flick Scott and Flick Sonya
Home Financials for this Owner
Home Financials are based on the most recent Mortgage that was taken out on this home.
Original Mortgage
$96,000
Interest Rate
5.12%
Mortgage Type
New Conventional
Create a Home Valuation Report for This Property
The Home Valuation Report is an in-depth analysis detailing your home's value as well as a comparison with similar homes in the area
Home Values in the Area
Average Home Value in this Area
Purchase History
| Date | Buyer | Sale Price | Title Company |
|---|---|---|---|
| Flick Scott | -- | Land Title | |
| Flick Scott | $120,000 | Metropolitan Title Company |
Source: Public Records
Mortgage History
| Date | Status | Borrower | Loan Amount |
|---|---|---|---|
| Previous Owner | Flick Scott | $96,000 |
Source: Public Records
Tax History Compared to Growth
Tax History
| Year | Tax Paid | Tax Assessment Tax Assessment Total Assessment is a certain percentage of the fair market value that is determined by local assessors to be the total taxable value of land and additions on the property. | Land | Improvement |
|---|---|---|---|---|
| 2025 | $692 | $124,300 | $0 | $0 |
| 2024 | $692 | $108,200 | $0 | $0 |
| 2023 | $659 | $98,800 | $0 | $0 |
| 2022 | $2,060 | $88,800 | $0 | $0 |
| 2021 | $2,017 | $70,700 | $18,800 | $51,900 |
| 2020 | $1,915 | $70,700 | $18,800 | $51,900 |
| 2019 | $1,826 | $67,600 | $67,600 | $0 |
| 2018 | $1,783 | $63,400 | $63,400 | $0 |
| 2017 | $1,748 | $57,500 | $0 | $0 |
| 2016 | $1,737 | $55,300 | $0 | $0 |
| 2015 | $1,571 | $55,300 | $0 | $0 |
| 2014 | $1,575 | $51,900 | $0 | $0 |
| 2013 | -- | $52,500 | $52,500 | $0 |
Source: Public Records
Map
Nearby Homes
- 34830 N Riverview Dr
- 38480 M 40
- 34655 38th Ave
- 36561 M 40
- 34173 Vauxhill Dr
- 35780 36th Ave
- 41692 30th St
- 35918 Riverview Dr
- 47177 Klett Rd
- 37137 30th St
- 32787 Bradeen Ave
- 32846 32nd St
- 0 S M 43 Hwy
- 35553 M 43
- 48681 Valley Ct
- VL Cr-665 Rd
- 37057 Marrion Ct
- 35684 Michigan 43
- 37129 Marrion Ct
- 37011 Wahimund Ave