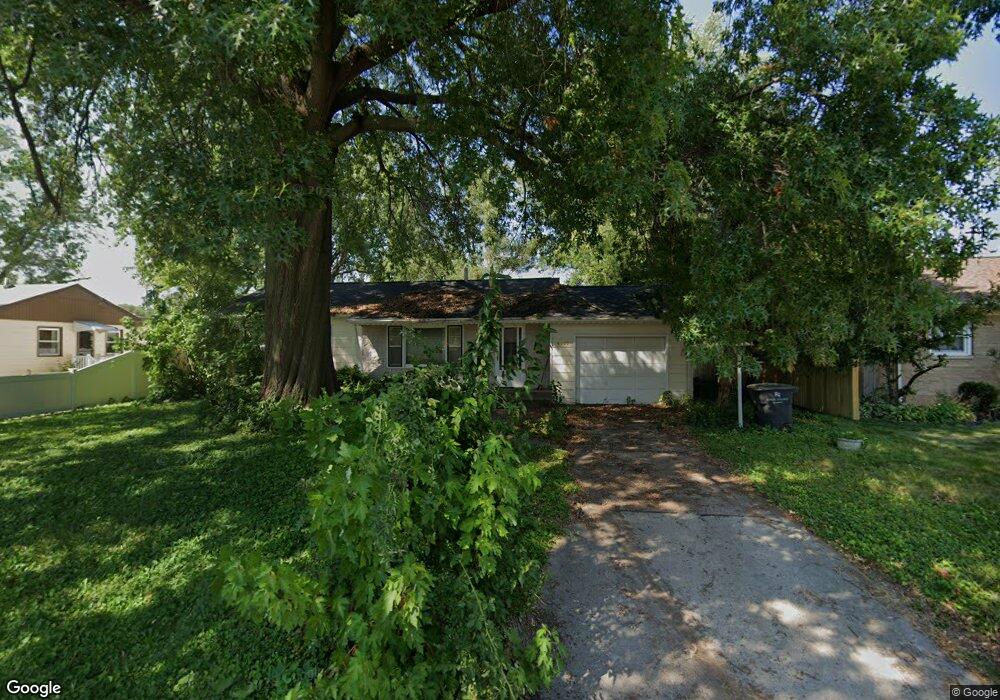
4055 25th Ave Rock Island, IL 61201
Saukie NeighborhoodEstimated Value: $131,000 - $182,000
--
Bed
1
Bath
980
Sq Ft
$157/Sq Ft
Est. Value
About This Home
This home is located at 4055 25th Ave, Rock Island, IL 61201 and is currently estimated at $154,234, approximately $157 per square foot. 4055 25th Ave is a home located in Rock Island County with nearby schools including Denkmann Elementary School, Washington Junior High School, and Rock Island High School.
Ownership History
Date
Name
Owned For
Owner Type
Purchase Details
Closed on
Apr 2, 2021
Sold by
Oksana Higgins
Bought by
Higgins Christopher A
Current Estimated Value
Home Financials for this Owner
Home Financials are based on the most recent Mortgage that was taken out on this home.
Original Mortgage
$85,000
Outstanding Balance
$63,038
Interest Rate
2.38%
Mortgage Type
New Conventional
Estimated Equity
$91,196
Purchase Details
Closed on
Jan 1, 1989
Create a Home Valuation Report for This Property
The Home Valuation Report is an in-depth analysis detailing your home's value as well as a comparison with similar homes in the area
Home Values in the Area
Average Home Value in this Area
Purchase History
| Date | Buyer | Sale Price | Title Company |
|---|---|---|---|
| Higgins Christopher A | -- | Bozeman Neighbour Patton & Noe | |
| -- | $52,000 | -- |
Source: Public Records
Mortgage History
| Date | Status | Borrower | Loan Amount |
|---|---|---|---|
| Open | Higgins Christopher A | $85,000 |
Source: Public Records
Tax History Compared to Growth
Tax History
| Year | Tax Paid | Tax Assessment Tax Assessment Total Assessment is a certain percentage of the fair market value that is determined by local assessors to be the total taxable value of land and additions on the property. | Land | Improvement |
|---|---|---|---|---|
| 2024 | -- | $48,192 | $12,953 | $35,239 |
| 2023 | -- | $44,092 | $11,851 | $32,241 |
| 2022 | $0 | $38,656 | $10,390 | $28,266 |
| 2021 | $0 | $36,710 | $9,867 | $26,843 |
| 2020 | $0 | $35,710 | $9,598 | $26,112 |
| 2019 | $13,523 | $35,356 | $9,503 | $25,853 |
| 2018 | $0 | $34,426 | $9,253 | $25,173 |
| 2017 | -- | $33,283 | $8,946 | $24,337 |
| 2016 | -- | $33,283 | $8,946 | $24,337 |
| 2015 | -- | $33,283 | $8,946 | $24,337 |
| 2014 | -- | $33,202 | $8,924 | $24,278 |
| 2013 | -- | $33,202 | $8,924 | $24,278 |
Source: Public Records
Map
Nearby Homes