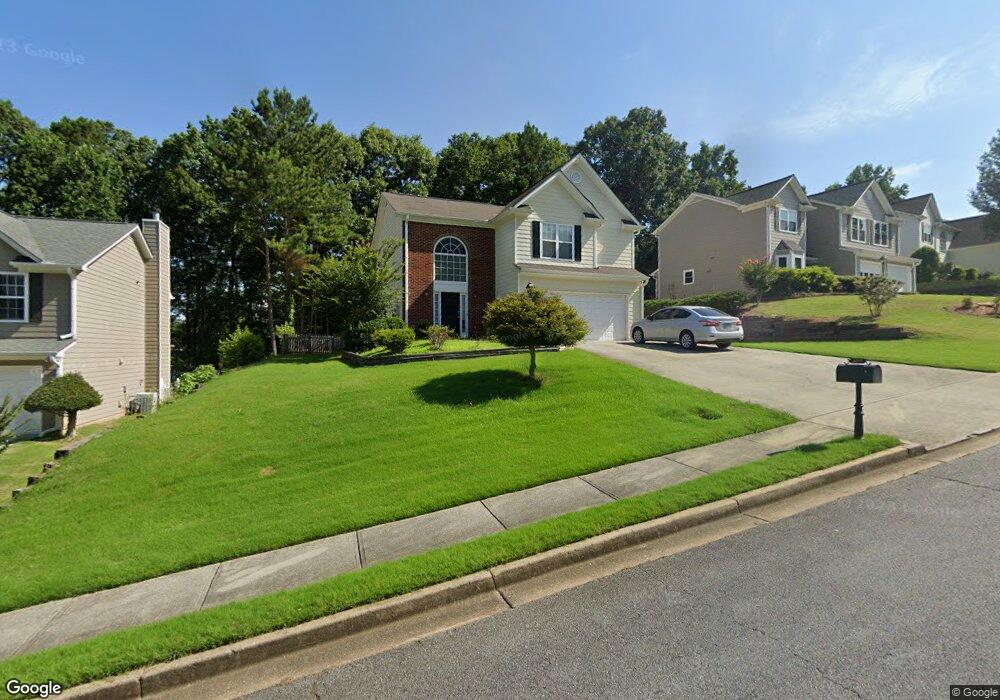
4055 Brushy Creek Way Unit 2 Suwanee, GA 30024
Estimated Value: $442,357 - $475,000
3
Beds
3
Baths
1,821
Sq Ft
$252/Sq Ft
Est. Value
About This Home
This home is located at 4055 Brushy Creek Way Unit 2, Suwanee, GA 30024 and is currently estimated at $458,589, approximately $251 per square foot. 4055 Brushy Creek Way Unit 2 is a home located in Gwinnett County with nearby schools including Roberts Elementary School, North Gwinnett Middle School, and North Gwinnett High School.
Ownership History
Date
Name
Owned For
Owner Type
Purchase Details
Closed on
Feb 19, 2015
Sold by
Hwang Ken
Bought by
Bong James K and Bong Kimberly K
Current Estimated Value
Purchase Details
Closed on
Aug 5, 2011
Sold by
Your Home Solutions Llc
Bought by
Hwang Ken
Purchase Details
Closed on
Jun 7, 2011
Sold by
Edris Mohammed
Bought by
Your Home Solutions Llc
Purchase Details
Closed on
Dec 31, 2003
Sold by
Islam Mohamed A
Bought by
Edris Mohammed
Home Financials for this Owner
Home Financials are based on the most recent Mortgage that was taken out on this home.
Original Mortgage
$144,000
Interest Rate
5.38%
Mortgage Type
New Conventional
Purchase Details
Closed on
Mar 30, 1999
Sold by
Richport Properties Inc
Bought by
Isla Mohamed A
Home Financials for this Owner
Home Financials are based on the most recent Mortgage that was taken out on this home.
Original Mortgage
$117,550
Interest Rate
6.85%
Mortgage Type
FHA
Create a Home Valuation Report for This Property
The Home Valuation Report is an in-depth analysis detailing your home's value as well as a comparison with similar homes in the area
Home Values in the Area
Average Home Value in this Area
Purchase History
| Date | Buyer | Sale Price | Title Company |
|---|---|---|---|
| Bong James K | $180,000 | -- | |
| Hwang Ken | $124,500 | -- | |
| Your Home Solutions Llc | $83,901 | -- | |
| Edris Mohammed | $180,000 | -- | |
| Isla Mohamed A | $143,200 | -- |
Source: Public Records
Mortgage History
| Date | Status | Borrower | Loan Amount |
|---|---|---|---|
| Previous Owner | Edris Mohammed | $144,000 | |
| Previous Owner | Isla Mohamed A | $117,550 |
Source: Public Records
Tax History Compared to Growth
Tax History
| Year | Tax Paid | Tax Assessment Tax Assessment Total Assessment is a certain percentage of the fair market value that is determined by local assessors to be the total taxable value of land and additions on the property. | Land | Improvement |
|---|---|---|---|---|
| 2025 | $5,115 | $161,880 | $33,600 | $128,280 |
| 2024 | $4,403 | $161,880 | $33,600 | $128,280 |
| 2023 | $4,403 | $161,880 | $33,600 | $128,280 |
| 2022 | $3,885 | $102,520 | $22,000 | $80,520 |
| 2021 | $3,868 | $102,520 | $22,000 | $80,520 |
| 2020 | $3,894 | $102,520 | $22,000 | $80,520 |
| 2019 | $3,014 | $91,440 | $18,480 | $72,960 |
| 2018 | $3,027 | $91,440 | $18,480 | $72,960 |
| 2016 | $2,381 | $72,000 | $24,000 | $48,000 |
| 2015 | $2,396 | $71,480 | $17,600 | $53,880 |
| 2014 | -- | $49,800 | $12,000 | $37,800 |
Source: Public Records
Map
Nearby Homes
- 733 Vinebrook Ln Unit 3
- 3880 Brushy Creek Way
- 1621 Wellborn Walk
- The Murray Plan at Old Town Suwanee
- The Telfair Plan at Old Town Suwanee
- 952 Cambron Commons Trace
- 1350 Peachtree Industrial Blvd
- 911 Echo Park Dr
- 923 Echo Park Dr
- 645 Stonepark Ln
- 4265 Lansmoore Crossing
- 4339 Lansfaire Terrace Unit 4
- 1116 Bartlett Trace
- 3301 Bennett Creek Ln
- 3170 Bennett Creek Ln
- 3444 Benedict Place
- 3625 Belle Fields Crossing
- 3655 Belle Fields Crossing
- 3675 Belle Fields Crossing
- 3645 Belle Fields Crossing
- 4065 Brushy Creek Way
- 4045 Brushy Creek Way
- 4085 Brushy Creek Way Unit 2
- 4035 Brushy Creek Way Unit 2
- 4025 Brushy Creek Way Unit 2
- 4060 Brushy Creek Way
- 4050 Brushy Creek Way
- 4040 Brushy Creek Way
- 4070 Brushy Creek Way
- 4015 Brushy Creek Way
- 4080 Brushy Creek Way Unit 2
- 4020 Brushy Creek Way Unit 2
- 4090 Brushy Creek Way Unit 2
- 3995 Brushy Creek Way
- 4105 Brushy Creek Way
- 792 Eva Kennedy Rd
- 3998 Brushy Creek Way
- 4115 Brushy Creek Way
- 0 Brushy Creek Way
- 3985 Brushy Creek Way