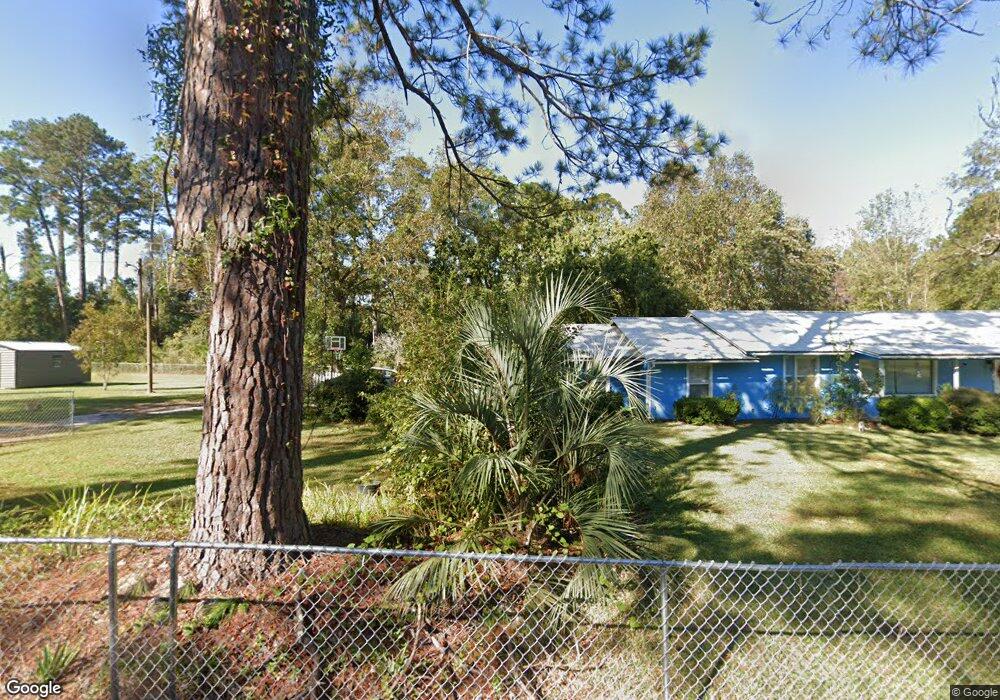
4055 Lynn Ave Waycross, GA 31503
Estimated Value: $264,000 - $305,000
4
Beds
2
Baths
2,726
Sq Ft
$104/Sq Ft
Est. Value
About This Home
This home is located at 4055 Lynn Ave, Waycross, GA 31503 and is currently estimated at $282,498, approximately $103 per square foot. 4055 Lynn Ave is a home located in Ware County with nearby schools including Wacona Elementary School, Ware County Middle School, and Ware County High School.
Ownership History
Date
Name
Owned For
Owner Type
Purchase Details
Closed on
Feb 24, 2022
Sold by
Kitchen Rosetta
Bought by
Howard Raymond and Howard Kisha Lee
Current Estimated Value
Home Financials for this Owner
Home Financials are based on the most recent Mortgage that was taken out on this home.
Original Mortgage
$191,250
Interest Rate
3.92%
Mortgage Type
Cash
Purchase Details
Closed on
Feb 10, 2021
Sold by
Davis David Aubrey
Bought by
Kitchen Rosetta
Home Financials for this Owner
Home Financials are based on the most recent Mortgage that was taken out on this home.
Original Mortgage
$180,000
Interest Rate
2.7%
Mortgage Type
VA
Purchase Details
Closed on
Dec 27, 2012
Sold by
Davis David Aubrey
Bought by
Davis David Aubrey and Davis Diane Renee
Purchase Details
Closed on
Aug 5, 2005
Sold by
Carter Bobby R
Bought by
Davis David A
Home Financials for this Owner
Home Financials are based on the most recent Mortgage that was taken out on this home.
Original Mortgage
$96,000
Interest Rate
5.57%
Mortgage Type
New Conventional
Create a Home Valuation Report for This Property
The Home Valuation Report is an in-depth analysis detailing your home's value as well as a comparison with similar homes in the area
Home Values in the Area
Average Home Value in this Area
Purchase History
| Date | Buyer | Sale Price | Title Company |
|---|---|---|---|
| Howard Raymond | $22,500 | -- | |
| Kitchen Rosetta | $180,000 | -- | |
| Davis David Aubrey | -- | -- | |
| Davis David A | -- | -- |
Source: Public Records
Mortgage History
| Date | Status | Borrower | Loan Amount |
|---|---|---|---|
| Closed | Howard Raymond | $191,250 | |
| Previous Owner | Kitchen Rosetta | $180,000 | |
| Previous Owner | Davis David A | $96,000 |
Source: Public Records
Tax History Compared to Growth
Tax History
| Year | Tax Paid | Tax Assessment Tax Assessment Total Assessment is a certain percentage of the fair market value that is determined by local assessors to be the total taxable value of land and additions on the property. | Land | Improvement |
|---|---|---|---|---|
| 2024 | $2,657 | $93,634 | $13,140 | $80,494 |
| 2023 | $2,410 | $53,163 | $8,810 | $44,353 |
| 2022 | $1,840 | $63,710 | $8,810 | $54,900 |
| 2021 | $1,600 | $50,999 | $8,810 | $42,189 |
| 2020 | $1,502 | $49,680 | $8,810 | $40,870 |
| 2019 | $1,499 | $48,362 | $8,810 | $39,552 |
| 2018 | $1,234 | $39,819 | $8,810 | $31,009 |
| 2017 | $1,233 | $39,819 | $8,810 | $31,009 |
| 2016 | $1,233 | $39,819 | $8,810 | $31,009 |
| 2015 | $1,245 | $39,818 | $8,810 | $31,009 |
| 2014 | $1,243 | $39,818 | $8,810 | $31,009 |
| 2013 | -- | $39,818 | $8,809 | $31,008 |
Source: Public Records
Map
Nearby Homes
- 4190 Church Street Extension
- 3825 Jamestown Rd
- 3860 Blalock Ave
- 3648 Tanner Ln
- 1691 Huckaby Rd
- 1621 Meadowood Dr
- 123 Winn Clay Dr
- Tract 2,3 Stetson Dr
- 2508 Mesa Rd
- 06 Alton Cir
- 03 Alton Cir
- 02 Alton Cir
- 04 Alton Cir
- 01 Alton Cir
- 2885 Ben St
- 2879 Ben St
- 2869 Ben St
- 5802 River Trail
- 221 Sierra Ln
- 5768 Holly Dr
- 4055 Lynn Avenue Extension
- 4030 Lynn Ave
- 4030 Lynn Avenue Extension
- 4090 Lynn Avenue Extension
- 3990 Lynn Ave
- 3990 Lynn Avenue Extension
- 3945 Lynn Avenue Extension
- 3945 Lynn Avenue Extension
- 4025 Church St
- 2125 Lynn Avenue Extension
- 4005 Church St
- 3960 Lynn Avenue Extension
- 4055 Church St
- 3995 Church St
- 3985 Church St
- 2120 Lynn Avenue Extension
- 3965 Church St
- 4050 Church St
- 2100 Lynn Avenue Extension
- 3945 Church St