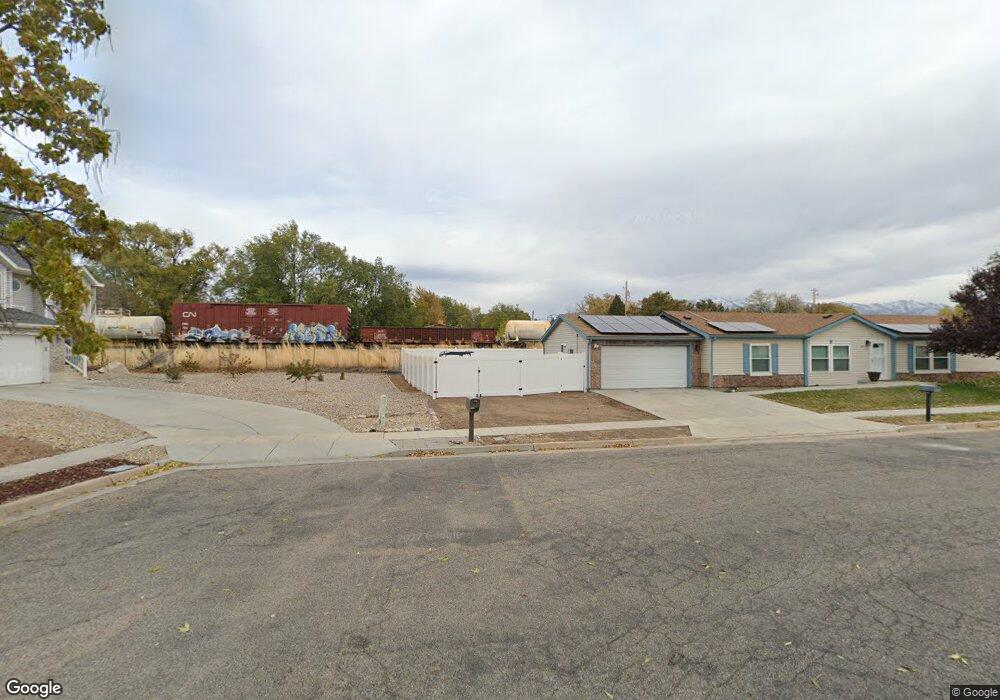
4055 W 600 N Clearfield, UT 84015
Estimated Value: $535,000 - $635,000
3
Beds
4
Baths
2,029
Sq Ft
$291/Sq Ft
Est. Value
About This Home
This home is located at 4055 W 600 N, Clearfield, UT 84015 and is currently estimated at $590,184, approximately $290 per square foot. 4055 W 600 N is a home located in Davis County with nearby schools including West Point School, West Point Junior High School, and Syracuse High School.
Ownership History
Date
Name
Owned For
Owner Type
Purchase Details
Closed on
Dec 8, 2020
Sold by
Umpleby Richard C
Bought by
Umpleby Richard Charles and Richard C Umpleby Family Livin
Current Estimated Value
Purchase Details
Closed on
Oct 26, 2004
Sold by
Umpleby Elizabeth M and Umpleby Richard C
Bought by
Umpleby Richard C
Home Financials for this Owner
Home Financials are based on the most recent Mortgage that was taken out on this home.
Original Mortgage
$207,000
Interest Rate
5.74%
Mortgage Type
New Conventional
Purchase Details
Closed on
Oct 24, 1996
Sold by
Craythorne Construction Company Inc
Bought by
Umpleby Elizabeth M and Umpleby Richard C
Home Financials for this Owner
Home Financials are based on the most recent Mortgage that was taken out on this home.
Original Mortgage
$136,350
Interest Rate
8.3%
Create a Home Valuation Report for This Property
The Home Valuation Report is an in-depth analysis detailing your home's value as well as a comparison with similar homes in the area
Home Values in the Area
Average Home Value in this Area
Purchase History
| Date | Buyer | Sale Price | Title Company |
|---|---|---|---|
| Umpleby Richard Charles | -- | None Available | |
| Richard C Umpleby Family Living Trust | -- | None Listed On Document | |
| Umpleby Richard C | -- | Bonneville Title Company Inc | |
| Umpleby Elizabeth M | -- | Bonneville Title Company Inc |
Source: Public Records
Mortgage History
| Date | Status | Borrower | Loan Amount |
|---|---|---|---|
| Previous Owner | Umpleby Richard C | $207,000 | |
| Previous Owner | Umpleby Elizabeth M | $136,350 |
Source: Public Records
Tax History
| Year | Tax Paid | Tax Assessment Tax Assessment Total Assessment is a certain percentage of the fair market value that is determined by local assessors to be the total taxable value of land and additions on the property. | Land | Improvement |
|---|---|---|---|---|
| 2025 | $3,375 | $316,250 | $112,687 | $203,563 |
| 2024 | $3,085 | $290,400 | $101,452 | $188,948 |
| 2023 | $2,859 | $495,000 | $126,380 | $368,620 |
| 2022 | $3,093 | $293,150 | $65,716 | $227,434 |
| 2021 | $2,948 | $418,000 | $102,765 | $315,235 |
| 2020 | $2,480 | $347,000 | $86,316 | $260,684 |
| 2019 | $2,472 | $341,000 | $83,748 | $257,252 |
| 2018 | $2,302 | $313,000 | $83,784 | $229,216 |
| 2016 | $2,067 | $147,895 | $32,416 | $115,479 |
| 2015 | $1,964 | $133,155 | $32,416 | $100,739 |
| 2014 | $1,893 | $130,183 | $32,416 | $97,767 |
| 2013 | -- | $109,163 | $36,718 | $72,445 |
Source: Public Records
Map
Nearby Homes
- 3902 W 825 N
- 477 N 4500 W
- 120 N 4325 W
- 148 N 3830 W
- 3757 W 200 N
- 4362 West St Unit 106
- 4358 West St Unit 105
- 114 3830 W
- 3833 W 50 S Unit 429
- 3827 W 50 S Unit 431
- 4669 W 75 N
- 4901 W 650 N
- 4260 W 350 S
- 356 S 4300 W Unit 611
- 4857 Pintail Way
- 364 S 4300 W Unit 610
- 372 S 4300 W Unit 609
- 387 S 4250 W
- 388 S 4300 W Unit 607
- 396 S 4300 W
Your Personal Tour Guide
Ask me questions while you tour the home.