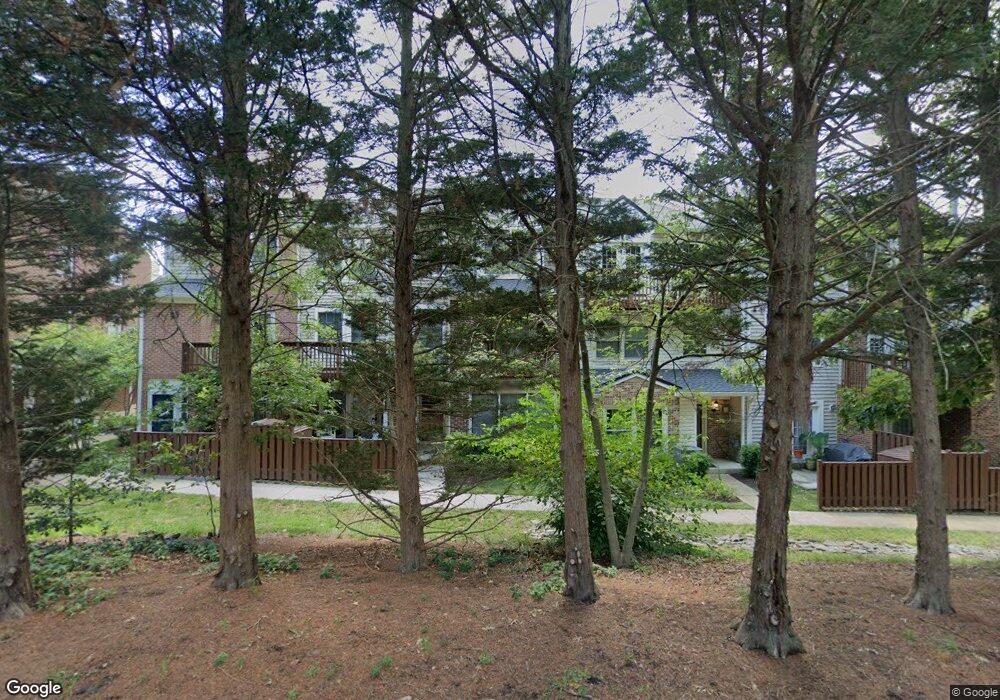
4056 Chetham Way Woodbridge, VA 22192
Westridge NeighborhoodEstimated Value: $407,000 - $418,000
3
Beds
2
Baths
1,916
Sq Ft
$215/Sq Ft
Est. Value
About This Home
This home is located at 4056 Chetham Way, Woodbridge, VA 22192 and is currently estimated at $411,543, approximately $214 per square foot. 4056 Chetham Way is a home located in Prince William County with nearby schools including Westridge Elementary School, Woodbridge Middle School, and Woodbridge High School.
Ownership History
Date
Name
Owned For
Owner Type
Purchase Details
Closed on
Feb 20, 2008
Sold by
Deutsche Bank National Tr
Bought by
Turner Craig A
Current Estimated Value
Home Financials for this Owner
Home Financials are based on the most recent Mortgage that was taken out on this home.
Original Mortgage
$203,340
Outstanding Balance
$126,506
Interest Rate
5.8%
Mortgage Type
FHA
Estimated Equity
$285,037
Purchase Details
Closed on
Jul 31, 2006
Sold by
King Robert K
Bought by
Poku Kwaku and Danso,Theresa
Home Financials for this Owner
Home Financials are based on the most recent Mortgage that was taken out on this home.
Original Mortgage
$244,000
Interest Rate
6.67%
Mortgage Type
New Conventional
Purchase Details
Closed on
Jan 20, 2001
Sold by
King Robert
Bought by
King Robert and King,Linda
Create a Home Valuation Report for This Property
The Home Valuation Report is an in-depth analysis detailing your home's value as well as a comparison with similar homes in the area
Home Values in the Area
Average Home Value in this Area
Purchase History
| Date | Buyer | Sale Price | Title Company |
|---|---|---|---|
| Turner Craig A | $206,000 | -- | |
| Poku Kwaku | $305,000 | -- | |
| King Robert | -- | -- |
Source: Public Records
Mortgage History
| Date | Status | Borrower | Loan Amount |
|---|---|---|---|
| Open | Turner Craig A | $203,340 | |
| Previous Owner | Poku Kwaku | $244,000 |
Source: Public Records
Tax History Compared to Growth
Tax History
| Year | Tax Paid | Tax Assessment Tax Assessment Total Assessment is a certain percentage of the fair market value that is determined by local assessors to be the total taxable value of land and additions on the property. | Land | Improvement |
|---|---|---|---|---|
| 2025 | $3,300 | $366,500 | $98,800 | $267,700 |
| 2024 | $3,300 | $331,800 | $89,000 | $242,800 |
| 2023 | $3,281 | $315,300 | $82,000 | $233,300 |
| 2022 | $3,444 | $303,700 | $82,000 | $221,700 |
| 2021 | $3,277 | $267,300 | $69,700 | $197,600 |
| 2020 | $3,678 | $237,300 | $66,700 | $170,600 |
| 2019 | $3,553 | $229,200 | $59,400 | $169,800 |
| 2018 | $2,621 | $217,100 | $55,600 | $161,500 |
| 2017 | $2,669 | $214,800 | $54,700 | $160,100 |
| 2016 | $2,526 | $205,000 | $51,900 | $153,100 |
| 2015 | $2,251 | $199,200 | $50,000 | $149,200 |
| 2014 | $2,251 | $178,100 | $46,600 | $131,500 |
Source: Public Records
Map
Nearby Homes
- 4104 Churchman Way
- 12608 Kempston Ln
- 12551 Kempston Ln
- 4140 Hummel Way
- 12289 Arabian Place
- 12687 Perchance Terrace
- 4114 Hampstead Ln
- 12390 Manchester Way
- 12804 Evansport Place
- 12213 Stevenson Ct Unit 12213
- 3988 Cressida Place
- 12240 Stevenson Ct
- 12165 Abbey Glen Ct
- 4030 Cressida Place
- 12899 Bjork Ln
- 12199 Chaucer Ln
- 12309 Ashmont Ct Unit 203
- 12067 Stallion Ct
- 12608 Aubrey Glen Terrace
- 12658 Stone Lined Cir
- 4056 Chetham Way Unit 17-175
- 4058 Chetham Way
- 4058 Chetham Way Unit 17-176
- 4046 Chetham Way Unit 17
- 4046 Chetham Way Unit 17179
- 4054 Chetham Way
- 4044 Chetham Way
- 4048 Chetham Way Unit 17178
- 4050 Chetham Way
- 4050 Chetham Way Unit 17-177
- 4052 Chetham Way
- 4032 Chetham Way
- 4030 Chetham Way Unit 19199
- 4034 Chetham Way
- 4028 Chetham Way
- 4028 Chetham Way Unit 19
- 4033 Chetham Way
- 4033 Chetham Way Unit 18-186
- 4036 Chetham Way
- 4036 Chetham Way Unit 19