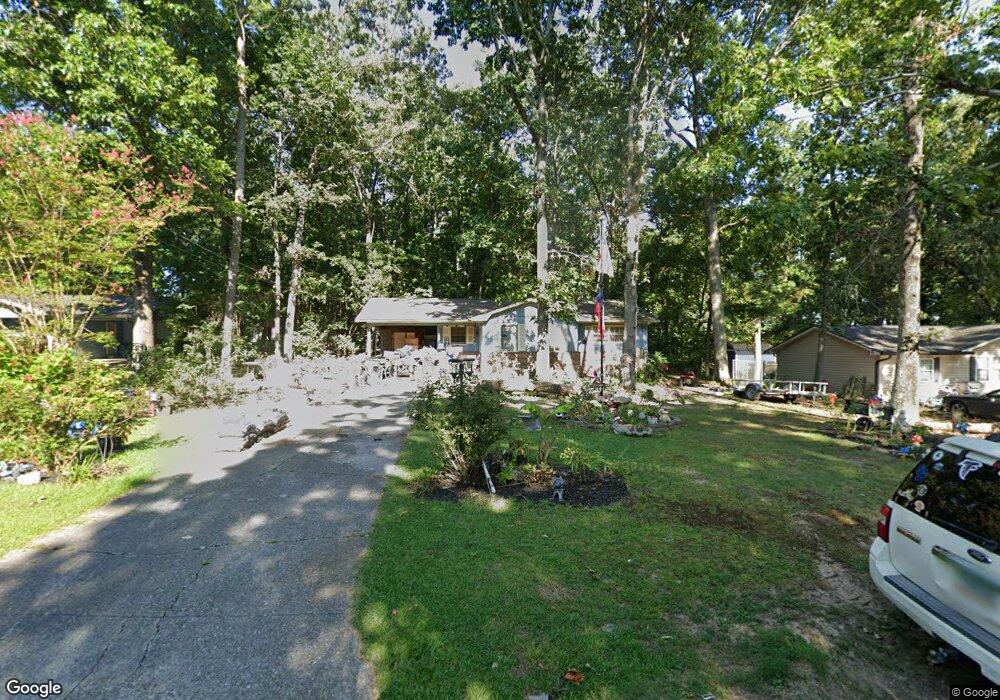
4056 W Parliment Dr Cohutta, GA 30710
Estimated Value: $203,000 - $219,000
--
Bed
2
Baths
1,224
Sq Ft
$172/Sq Ft
Est. Value
About This Home
This home is located at 4056 W Parliment Dr, Cohutta, GA 30710 and is currently estimated at $210,606, approximately $172 per square foot. 4056 W Parliment Dr is a home located in Whitfield County with nearby schools including Cohutta Elementary School and Coahulla Creek High School.
Ownership History
Date
Name
Owned For
Owner Type
Purchase Details
Closed on
Nov 13, 2009
Sold by
Roberts Shirley
Bought by
Neal Ronald M
Current Estimated Value
Home Financials for this Owner
Home Financials are based on the most recent Mortgage that was taken out on this home.
Original Mortgage
$67,612
Outstanding Balance
$44,012
Interest Rate
4.94%
Mortgage Type
FHA
Estimated Equity
$166,594
Purchase Details
Closed on
May 26, 2009
Sold by
Lasalle Banknational Assoc
Bought by
Roberts Shirley
Purchase Details
Closed on
Mar 30, 2007
Sold by
Stafford Rika
Bought by
Teem Scott
Home Financials for this Owner
Home Financials are based on the most recent Mortgage that was taken out on this home.
Original Mortgage
$84,000
Interest Rate
6.15%
Mortgage Type
New Conventional
Purchase Details
Closed on
Jul 17, 2001
Sold by
Stafford Terrie G and Stafford Roy L
Bought by
Stafford Ryan Lee and Stafford Rika
Purchase Details
Closed on
May 1, 1997
Bought by
Stafford Terrie G and Stafford Roy L
Create a Home Valuation Report for This Property
The Home Valuation Report is an in-depth analysis detailing your home's value as well as a comparison with similar homes in the area
Home Values in the Area
Average Home Value in this Area
Purchase History
| Date | Buyer | Sale Price | Title Company |
|---|---|---|---|
| Neal Ronald M | $68,900 | -- | |
| Roberts Shirley | $42,000 | -- | |
| Teem Scott | $84,000 | -- | |
| Stafford Ryan Lee | -- | -- | |
| Stafford Terrie G | -- | -- |
Source: Public Records
Mortgage History
| Date | Status | Borrower | Loan Amount |
|---|---|---|---|
| Open | Roberts Shirley | $67,612 | |
| Previous Owner | Teem Scott | $84,000 |
Source: Public Records
Tax History Compared to Growth
Tax History
| Year | Tax Paid | Tax Assessment Tax Assessment Total Assessment is a certain percentage of the fair market value that is determined by local assessors to be the total taxable value of land and additions on the property. | Land | Improvement |
|---|---|---|---|---|
| 2024 | $1,324 | $60,456 | $8,460 | $51,996 |
| 2023 | $1,324 | $48,046 | $8,000 | $40,046 |
| 2022 | $664 | $28,787 | $5,250 | $23,537 |
| 2021 | $664 | $28,787 | $5,250 | $23,537 |
| 2020 | $673 | $28,787 | $5,250 | $23,537 |
| 2019 | $678 | $28,787 | $5,250 | $23,537 |
| 2018 | $724 | $29,991 | $5,250 | $24,741 |
| 2017 | $725 | $29,991 | $5,250 | $24,741 |
| 2016 | $639 | $27,752 | $5,250 | $22,502 |
| 2014 | $615 | $27,752 | $5,250 | $22,502 |
| 2013 | -- | $27,752 | $5,250 | $22,502 |
Source: Public Records
Map
Nearby Homes
- 4057 W Parliament Dr
- Lot 45 Edinburgh Place
- Lot 54 Wexford Place
- 213 Varnell Cedar St
- 4416 Wedgewood Ln
- 504 Ridge Pointe Ln
- Lot 64 Rochester Place
- Lot 61 Rochester Place
- Lot 58 Rochester Place
- Lot 59 Rochester Place
- Lot 44 Overlook Way
- 309 Highland Pointe Dr
- Lot 72 Woodbury Trail
- Lot 82 Highland Pointe Dr
- Lot 83 Highland Pointe Dr
- Lot 95 Highland Pointe Dr
- LOT 52 Highland Pointe Dr
- Lot 89 Highland Pointe Dr
- Lot 81 Highland Pointe Dr
- Lot 94 Highland Pointe Dr
- 4056 W Parliament Dr
- 4054 W Parliment Dr
- 4054 W Parliament Dr
- 4058 W Parliament Dr
- 4060 W Parliment Dr
- 4060 W Parliament Dr
- 4055 W Parliment Dr
- 4057 W Parliment Dr
- 4053 W Parliment Dr
- 4055 Village Dr
- 4062 W Parliment Dr
- 4062 W Parliament Dr
- 4061 Village Dr
- 4059 W Parliment Dr
- 4053 Village Dr
- 4051 W Parliament Dr
- 4059 Village Dr
- 811 Kings Row
- 4056 Village Dr
- 4049 W Parliment Dr