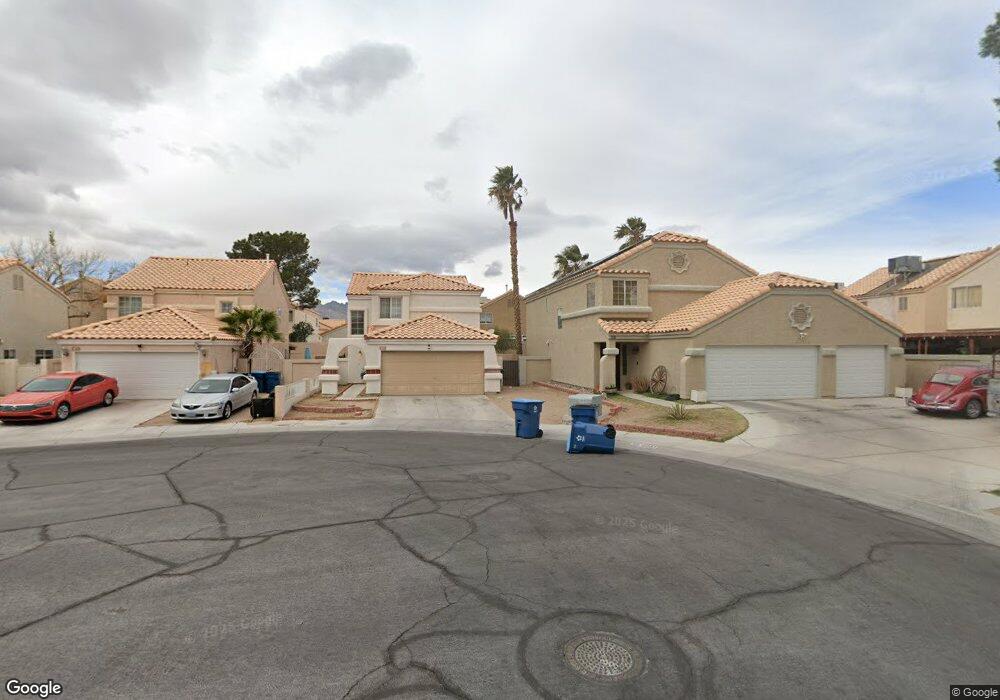
4057 Elkridge Dr Unit none Las Vegas, NV 89129
Lone Mountain NeighborhoodEstimated Value: $401,221 - $423,000
3
Beds
3
Baths
1,708
Sq Ft
$243/Sq Ft
Est. Value
About This Home
This home is located at 4057 Elkridge Dr Unit none, Las Vegas, NV 89129 and is currently estimated at $414,555, approximately $242 per square foot. 4057 Elkridge Dr Unit none is a home located in Clark County with nearby schools including Marc Kahre Elementary School, Dorothy Eisenberg Elementary School, and Justice Myron E Leavitt Middle School.
Ownership History
Date
Name
Owned For
Owner Type
Purchase Details
Closed on
Jun 1, 2005
Sold by
Medina Merrily H
Bought by
Medina Matthew H
Current Estimated Value
Purchase Details
Closed on
Dec 22, 2004
Sold by
Medina Merrily
Bought by
Medina Matthew H
Purchase Details
Closed on
Dec 20, 2004
Sold by
Medina James J and Medina Diana
Bought by
Medina James P and Medina Matthew H
Purchase Details
Closed on
Jul 2, 2003
Sold by
Rinaldi Anthony and Rinaldi James
Bought by
Medina James J and Medina Diana
Home Financials for this Owner
Home Financials are based on the most recent Mortgage that was taken out on this home.
Original Mortgage
$128,000
Outstanding Balance
$48,511
Interest Rate
4.04%
Mortgage Type
Unknown
Estimated Equity
$366,044
Create a Home Valuation Report for This Property
The Home Valuation Report is an in-depth analysis detailing your home's value as well as a comparison with similar homes in the area
Home Values in the Area
Average Home Value in this Area
Purchase History
| Date | Buyer | Sale Price | Title Company |
|---|---|---|---|
| Medina Matthew H | -- | Chicago Title | |
| Medina Mark K | -- | Chicago Title | |
| Medina Matthew H | -- | -- | |
| Medina James P | -- | -- | |
| Medina Mark K | -- | -- | |
| Medina James J | $160,000 | Old Republic Title Company |
Source: Public Records
Mortgage History
| Date | Status | Borrower | Loan Amount |
|---|---|---|---|
| Open | Medina James J | $128,000 |
Source: Public Records
Tax History Compared to Growth
Tax History
| Year | Tax Paid | Tax Assessment Tax Assessment Total Assessment is a certain percentage of the fair market value that is determined by local assessors to be the total taxable value of land and additions on the property. | Land | Improvement |
|---|---|---|---|---|
| 2025 | $1,763 | $80,514 | $33,600 | $46,914 |
| 2024 | $1,633 | $80,514 | $33,600 | $46,914 |
| 2023 | $1,633 | $73,910 | $28,700 | $45,210 |
| 2022 | $1,513 | $65,819 | $24,150 | $41,669 |
| 2021 | $1,401 | $61,360 | $21,350 | $40,010 |
| 2020 | $1,298 | $50,552 | $21,000 | $29,552 |
| 2019 | $1,216 | $59,642 | $19,950 | $39,692 |
| 2018 | $1,161 | $53,709 | $15,400 | $38,309 |
| 2017 | $1,752 | $53,438 | $14,350 | $39,088 |
| 2016 | $1,087 | $48,019 | $10,500 | $37,519 |
| 2015 | $1,084 | $41,242 | $9,100 | $32,142 |
| 2014 | $1,051 | $35,092 | $5,950 | $29,142 |
Source: Public Records
Map
Nearby Homes
- 4053 Hazelridge Dr
- 4109 Glenfield Cir
- 4061 Browndeer Cir
- 7223 Hollywood Park Ave
- 4025 Cunning Fellow Ct
- 4224 Perfect Drift St
- 4052 Cape Sand Dr
- 7251 Daily Double Ave
- 4025 Sea Hero St
- 4021 Sea Hero St Unit 1
- 3351 Dancing Waters St
- 3344 Dancing Waters St
- 3350 Dancing Waters St
- 4252 Olympic Point Dr
- 4205 Thunder Twice St
- 6900 Quail Hollow Dr
- 4356 Perfect Drift St
- 7408 Summer Crest Ln
- 7349 Dolphine Crest Ave
- 6920 Senton Ave
- 4057 Elkridge Dr
- 4053 Elkridge Dr
- 4053 Elkridge Dr
- 4061 Elkridge Dr
- 4049 Elkridge Dr
- 4052 Browndeer Cir
- 4052 N Browndeer Cir
- 4056 Browndeer Cir
- 4048 Browndeer Cir
- 7133 Larkvale Way
- 4060 Browndeer Cir
- 4060 Browndeer Cir Unit n/a
- 7137 Larkvale Way
- 7129 Larkvale Way Unit SFR
- 7129 Larkvale Way
- 4045 Elkridge Dr
- 4045 Elkridge Dr Unit n/a
- 4044 Browndeer Cir
- 4064 Browndeer Cir
- 7125 Larkvale Way