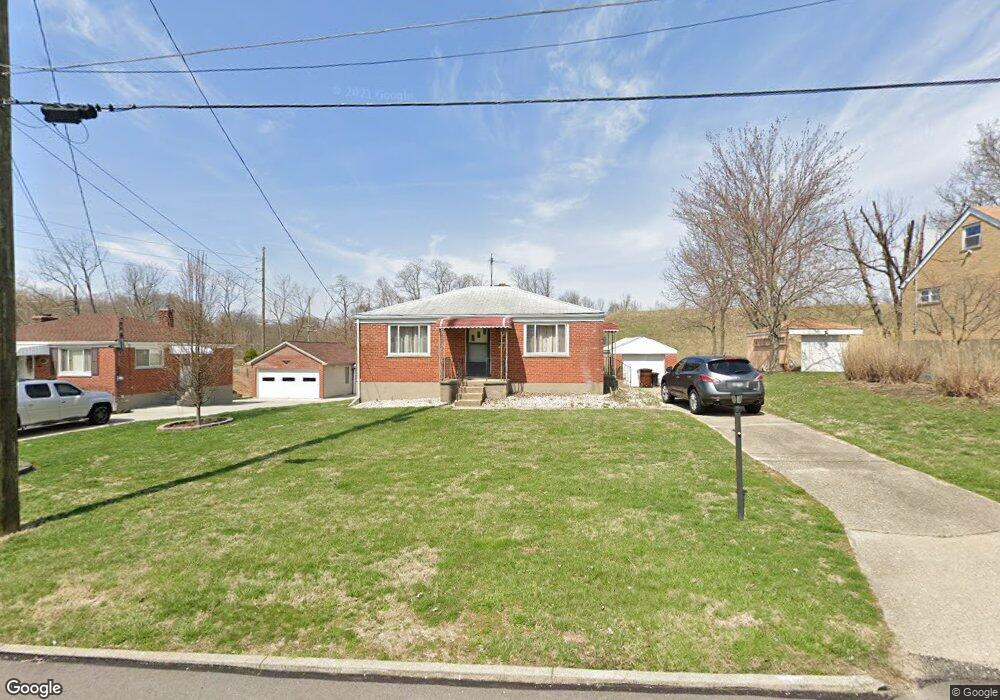
4057 Lee Ct Cincinnati, OH 45248
Estimated Value: $159,186 - $198,000
2
Beds
1
Bath
832
Sq Ft
$209/Sq Ft
Est. Value
About This Home
This home is located at 4057 Lee Ct, Cincinnati, OH 45248 and is currently estimated at $173,797, approximately $208 per square foot. 4057 Lee Ct is a home located in Hamilton County with nearby schools including Oakdale Elementary School, Bridgetown Middle School, and Oak Hills High School.
Ownership History
Date
Name
Owned For
Owner Type
Purchase Details
Closed on
Mar 31, 2025
Sold by
Mitchell Barbara
Bought by
Balsamo Home Investments Llc
Current Estimated Value
Home Financials for this Owner
Home Financials are based on the most recent Mortgage that was taken out on this home.
Original Mortgage
$113,900
Outstanding Balance
$113,015
Interest Rate
6.85%
Mortgage Type
Credit Line Revolving
Estimated Equity
$60,782
Purchase Details
Closed on
Dec 2, 2010
Sold by
Tallrigo Henry M
Bought by
Mitchell Barbara
Home Financials for this Owner
Home Financials are based on the most recent Mortgage that was taken out on this home.
Original Mortgage
$73,098
Interest Rate
4.5%
Mortgage Type
FHA
Purchase Details
Closed on
Jul 17, 2007
Sold by
Tallarigo Henry M
Bought by
Tallarigo Henry M
Create a Home Valuation Report for This Property
The Home Valuation Report is an in-depth analysis detailing your home's value as well as a comparison with similar homes in the area
Home Values in the Area
Average Home Value in this Area
Purchase History
| Date | Buyer | Sale Price | Title Company |
|---|---|---|---|
| Balsamo Home Investments Llc | $80,000 | None Listed On Document | |
| Balsamo Home Investments Llc | $80,000 | None Listed On Document | |
| Mitchell Barbara | $75,000 | America Homeland Title Agenc | |
| Tallarigo Henry M | -- | Attorney | |
| Hoskins Doug William | $4,000 | Attorney |
Source: Public Records
Mortgage History
| Date | Status | Borrower | Loan Amount |
|---|---|---|---|
| Open | Balsamo Home Investments Llc | $113,900 | |
| Closed | Balsamo Home Investments Llc | $113,900 | |
| Previous Owner | Mitchell Barbara | $73,098 |
Source: Public Records
Tax History
| Year | Tax Paid | Tax Assessment Tax Assessment Total Assessment is a certain percentage of the fair market value that is determined by local assessors to be the total taxable value of land and additions on the property. | Land | Improvement |
|---|---|---|---|---|
| 2025 | $2,237 | $42,732 | $10,668 | $32,064 |
| 2024 | $2,185 | $42,732 | $10,668 | $32,064 |
| 2023 | $2,185 | $42,732 | $10,668 | $32,064 |
| 2022 | $1,870 | $30,972 | $10,388 | $20,584 |
| 2021 | $1,682 | $30,972 | $10,388 | $20,584 |
| 2020 | $1,701 | $30,972 | $10,388 | $20,584 |
| 2019 | $1,667 | $27,654 | $9,275 | $18,379 |
| 2018 | $1,669 | $27,654 | $9,275 | $18,379 |
| 2017 | $1,575 | $27,654 | $9,275 | $18,379 |
| 2016 | $1,424 | $24,941 | $8,813 | $16,128 |
| 2015 | $1,435 | $24,941 | $8,813 | $16,128 |
| 2014 | $1,437 | $24,941 | $8,813 | $16,128 |
| 2013 | $1,414 | $26,250 | $9,275 | $16,975 |
Source: Public Records
Map
Nearby Homes
- 4081 Lee Ct
- 5636 Ohio Trail
- 5640 Ohio Trail
- 5648 Ohio Trail
- 5682 Ohio Trail
- 5686 Ohio Trail
- 5689 Ohio Trail
- 5694 Ohio Trail
- Cheswicke Plan at Trailside Village - Classic Series
- Serenity Plan at Trailside Village - Classic Series
- Cooke Plan at Trailside Village - Classic Series
- Hyde Park Plan at Trailside Village - Classic Series
- Covedale Plan at Trailside Village - Neo Traditional
- Morrison Plan at Trailside Village - Classic Series
- Faulkner Plan at Trailside Village - Classic Series
- Green Plan at Trailside Village - Classic Series
- Hampton Plan at Trailside Village - Classic Series
- Oak Hill Plan at Trailside Village - Classic Series
- Clayton Plan at Trailside Village - Classic Series
- Melville II Plan at Trailside Village - Classic Series
Your Personal Tour Guide
Ask me questions while you tour the home.