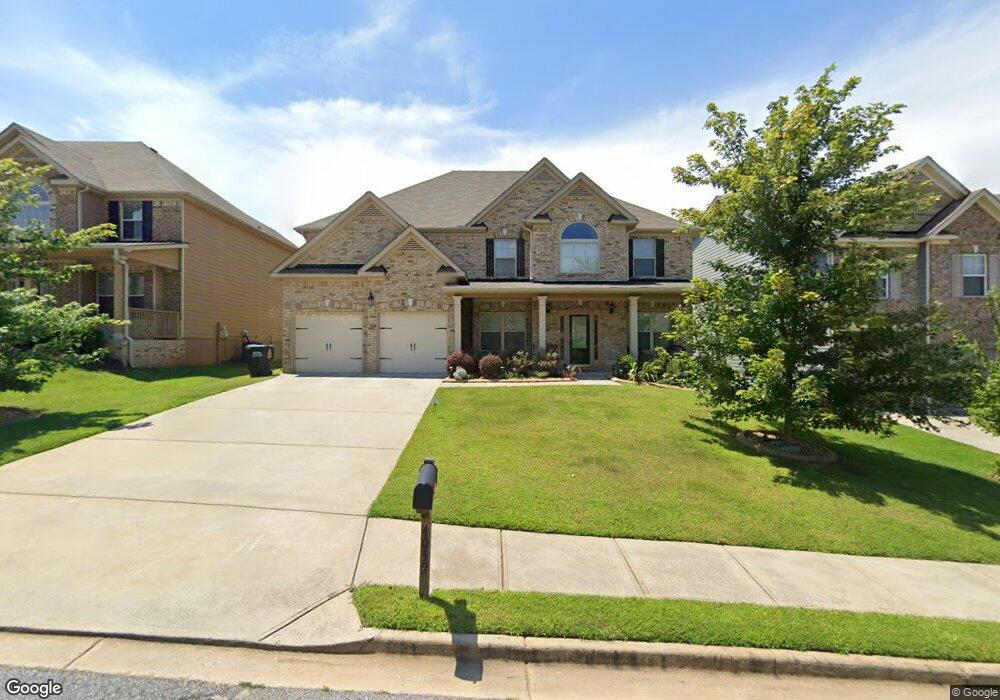
4059 Dinmont Chase Unit 191 Atlanta, GA 30349
Estimated Value: $414,492 - $454,000
5
Beds
4
Baths
3,536
Sq Ft
$122/Sq Ft
Est. Value
About This Home
This home is located at 4059 Dinmont Chase Unit 191, Atlanta, GA 30349 and is currently estimated at $432,623, approximately $122 per square foot. 4059 Dinmont Chase Unit 191 is a home located in Fulton County with nearby schools including Wolf Creek Elementary, Sandtown Middle School, and Langston Hughes High School.
Ownership History
Date
Name
Owned For
Owner Type
Purchase Details
Closed on
Nov 12, 2021
Sold by
Norman Joanne M
Bought by
Pierre Aimee Lynette
Current Estimated Value
Home Financials for this Owner
Home Financials are based on the most recent Mortgage that was taken out on this home.
Original Mortgage
$376,403
Outstanding Balance
$343,691
Interest Rate
3.05%
Mortgage Type
New Conventional
Estimated Equity
$88,932
Purchase Details
Closed on
Jun 28, 2013
Sold by
Peachtree Communities At P
Bought by
Norman Joanne M
Home Financials for this Owner
Home Financials are based on the most recent Mortgage that was taken out on this home.
Original Mortgage
$225,990
Interest Rate
3.79%
Mortgage Type
New Conventional
Purchase Details
Closed on
Dec 21, 2012
Sold by
Moja Opportunity Fund Llc
Bought by
Peachtree Communities At Pittm
Create a Home Valuation Report for This Property
The Home Valuation Report is an in-depth analysis detailing your home's value as well as a comparison with similar homes in the area
Home Values in the Area
Average Home Value in this Area
Purchase History
| Date | Buyer | Sale Price | Title Company |
|---|---|---|---|
| Pierre Aimee Lynette | $388,044 | -- | |
| Norman Joanne M | $225,990 | -- | |
| Peachtree Communities At Pittm | $155,000 | -- |
Source: Public Records
Mortgage History
| Date | Status | Borrower | Loan Amount |
|---|---|---|---|
| Open | Pierre Aimee Lynette | $376,403 | |
| Previous Owner | Norman Joanne M | $225,990 |
Source: Public Records
Tax History Compared to Growth
Tax History
| Year | Tax Paid | Tax Assessment Tax Assessment Total Assessment is a certain percentage of the fair market value that is determined by local assessors to be the total taxable value of land and additions on the property. | Land | Improvement |
|---|---|---|---|---|
| 2025 | $4,243 | $163,440 | $31,640 | $131,800 |
| 2023 | $4,523 | $160,240 | $32,720 | $127,520 |
| 2022 | $4,021 | $123,680 | $27,040 | $96,640 |
| 2021 | $2,794 | $120,080 | $26,240 | $93,840 |
| 2020 | $2,797 | $118,640 | $25,920 | $92,720 |
| 2019 | $2,846 | $98,320 | $12,680 | $85,640 |
| 2018 | $3,023 | $96,040 | $12,400 | $83,640 |
| 2017 | $2,605 | $81,000 | $14,200 | $66,800 |
| 2016 | $2,604 | $81,000 | $14,200 | $66,800 |
| 2015 | $2,115 | $81,000 | $14,200 | $66,800 |
| 2014 | $2,728 | $81,000 | $14,200 | $66,800 |
Source: Public Records
Map
Nearby Homes
- 4349 Sublime Trail
- 4027 Dinmont Chase
- 4249 Rosehall Ct
- 4360 Stonewall Tell Rd
- 5688 Baffin Rd
- 617 Maltese Dr
- 4380 Stonewall Tell Rd
- 546100 Stonewall Tell Rd
- 4395 Stonewall Tell Rd
- 4085 Trimrose Ct Unit LOT 160
- 4085 Trimrose Ct
- 5530 Rosehall Place
- 4081 Trimrose Ct
- 4084 Trimrose Ct
- 4084 Trimrose Ct Unit LOT 154
- 5615 Rosehall Place
- 5615 Rosehall Place Unit LOT 182
- 4080 Trimrose Ct
- 4080 Trimrose Ct Unit 153
- Travis Plan at Parkview Estates
- 4059 Dinmont Chase
- 4063 Dinmont Chase
- 4063 Dinmont Chase Unit 192
- 4055 Dinmont Chase
- 4055 Dinmont Chase Unit 190
- 4051 Dinmont Chase
- 4051 Dinmont Chase Unit 189
- 4067 Dinmont Chase
- 4333 Sublime Trail Unit 219
- 4333 Sublime Trail
- 4337 Sublime Trail Unit 220
- 4337 Sublime Trail
- 4043 Dinmont Chase
- 4329 Sublime Trail Unit 218
- 4329 Sublime Trail
- 4341 Sublime Trail Unit 221
- 4341 Sublime Trail
- 4054 Dinmont Chase
- 4071 Dinmont Chase
- 4058 Dinmont Chase