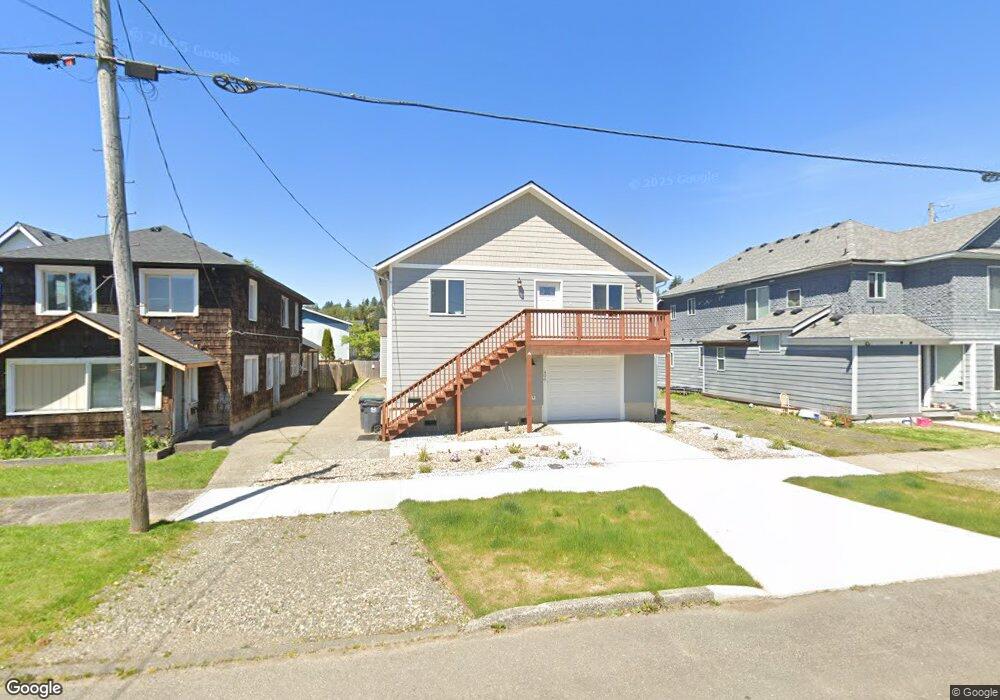
406 3rd St Unit 1 Hoquiam, WA 98550
Estimated Value: $329,000 - $377,165
5
Beds
3
Baths
2,040
Sq Ft
$173/Sq Ft
Est. Value
About This Home
This home is located at 406 3rd St Unit 1, Hoquiam, WA 98550 and is currently estimated at $353,791, approximately $173 per square foot. 406 3rd St Unit 1 is a home located in Grays Harbor County with nearby schools including Lincoln Elementary School, Emerson Elementary School, and Central Elementary School.
Ownership History
Date
Name
Owned For
Owner Type
Purchase Details
Closed on
Feb 21, 2024
Sold by
Lopez-Leal Rafael-Roberto
Bought by
Hongell Bryce Kenneth
Current Estimated Value
Home Financials for this Owner
Home Financials are based on the most recent Mortgage that was taken out on this home.
Original Mortgage
$331,000
Outstanding Balance
$325,205
Interest Rate
6.66%
Mortgage Type
New Conventional
Estimated Equity
$28,586
Purchase Details
Closed on
May 23, 2023
Sold by
Vanmeter Jimmy
Bought by
Roberto Rafael and Leal Lopez
Purchase Details
Closed on
Jun 23, 2017
Sold by
Vanmeter Jimmy
Bought by
Vanmeter Jimmy
Purchase Details
Closed on
Nov 12, 2015
Sold by
Niemann Douglas J and Niemann Joanne M
Bought by
Vanmeter Jimmy
Create a Home Valuation Report for This Property
The Home Valuation Report is an in-depth analysis detailing your home's value as well as a comparison with similar homes in the area
Home Values in the Area
Average Home Value in this Area
Purchase History
| Date | Buyer | Sale Price | Title Company |
|---|---|---|---|
| Hongell Bryce Kenneth | $350,000 | None Listed On Document | |
| Roberto Rafael | -- | None Listed On Document | |
| Vanmeter Jimmy | -- | None Available | |
| Vanmeter Jimmy | $55,000 | Coast Title |
Source: Public Records
Mortgage History
| Date | Status | Borrower | Loan Amount |
|---|---|---|---|
| Open | Hongell Bryce Kenneth | $331,000 |
Source: Public Records
Tax History Compared to Growth
Tax History
| Year | Tax Paid | Tax Assessment Tax Assessment Total Assessment is a certain percentage of the fair market value that is determined by local assessors to be the total taxable value of land and additions on the property. | Land | Improvement |
|---|---|---|---|---|
| 2025 | $3,580 | $379,951 | $29,160 | $350,791 |
| 2023 | $5,184 | $29,160 | $29,160 | $0 |
| 2022 | $694 | $109,245 | $18,225 | $91,020 |
| 2021 | $683 | $109,245 | $18,225 | $91,020 |
| 2020 | $705 | $100,970 | $18,225 | $82,745 |
| 2019 | $1,091 | $100,970 | $18,225 | $82,745 |
| 2018 | $1,301 | $81,875 | $18,225 | $63,650 |
| 2017 | $131 | $81,875 | $18,225 | $63,650 |
| 2016 | $1,199 | $81,875 | $18,225 | $63,650 |
| 2014 | -- | $79,625 | $18,225 | $61,400 |
| 2013 | -- | $72,400 | $18,225 | $54,175 |
Source: Public Records
Map
Nearby Homes