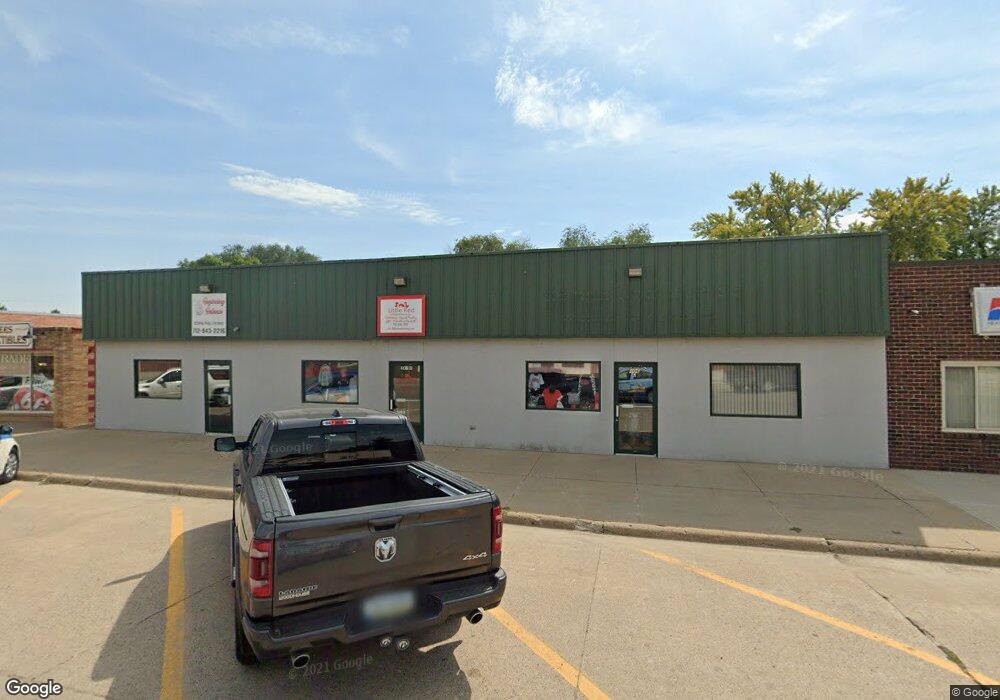
406 4th St Sergeant Bluff, IA 51054
Estimated Value: $319,034
Studio
--
Bath
4,900
Sq Ft
$65/Sq Ft
Est. Value
About This Home
This home is located at 406 4th St, Sergeant Bluff, IA 51054 and is currently estimated at $319,034, approximately $65 per square foot. 406 4th St is a home located in Woodbury County with nearby schools including Sergeant Bluff-Luton Primary School, Sergeant Bluff-Luton Elementary School, and Sergeant Bluff-Luton Middle School.
Ownership History
Date
Name
Owned For
Owner Type
Purchase Details
Closed on
Aug 9, 2019
Sold by
Nolan William F and Nolan Sandra A
Bought by
Cramer Roger D and Cramer Deborah A
Current Estimated Value
Home Financials for this Owner
Home Financials are based on the most recent Mortgage that was taken out on this home.
Original Mortgage
$180,000
Outstanding Balance
$156,271
Interest Rate
3.7%
Mortgage Type
New Conventional
Estimated Equity
$162,763
Purchase Details
Closed on
Mar 3, 2005
Sold by
Liberty National Bank
Bought by
Nolan William F and Nolan Sandra A
Create a Home Valuation Report for This Property
The Home Valuation Report is an in-depth analysis detailing your home's value as well as a comparison with similar homes in the area
Home Values in the Area
Average Home Value in this Area
Purchase History
| Date | Buyer | Sale Price | Title Company |
|---|---|---|---|
| Cramer Roger D | $210,000 | -- | |
| Nolan William F | $150,000 | -- |
Source: Public Records
Mortgage History
| Date | Status | Borrower | Loan Amount |
|---|---|---|---|
| Open | Cramer Roger D | $180,000 |
Source: Public Records
Tax History
| Year | Tax Paid | Tax Assessment Tax Assessment Total Assessment is a certain percentage of the fair market value that is determined by local assessors to be the total taxable value of land and additions on the property. | Land | Improvement |
|---|---|---|---|---|
| 2025 | $6,574 | $302,830 | $11,380 | $291,450 |
| 2024 | $65 | $295,570 | $11,380 | $284,190 |
| 2023 | $4,366 | $295,570 | $11,380 | $284,190 |
| 2022 | $3,686 | $209,790 | $11,380 | $198,410 |
| 2021 | $3,686 | $209,790 | $11,380 | $198,410 |
| 2020 | $3,726 | $209,790 | $11,380 | $198,410 |
| 2019 | $3,422 | $209,790 | $11,380 | $198,410 |
| 2018 | $3,340 | $189,950 | $11,260 | $178,690 |
| 2017 | $3,340 | $189,950 | $11,260 | $178,690 |
| 2016 | $3,690 | $189,950 | $0 | $0 |
| 2015 | $5,329 | $165,180 | $9,790 | $155,390 |
| 2014 | $5,437 | $165,180 | $9,790 | $155,390 |
Source: Public Records
Map
Nearby Homes
Your Personal Tour Guide
Ask me questions while you tour the home.