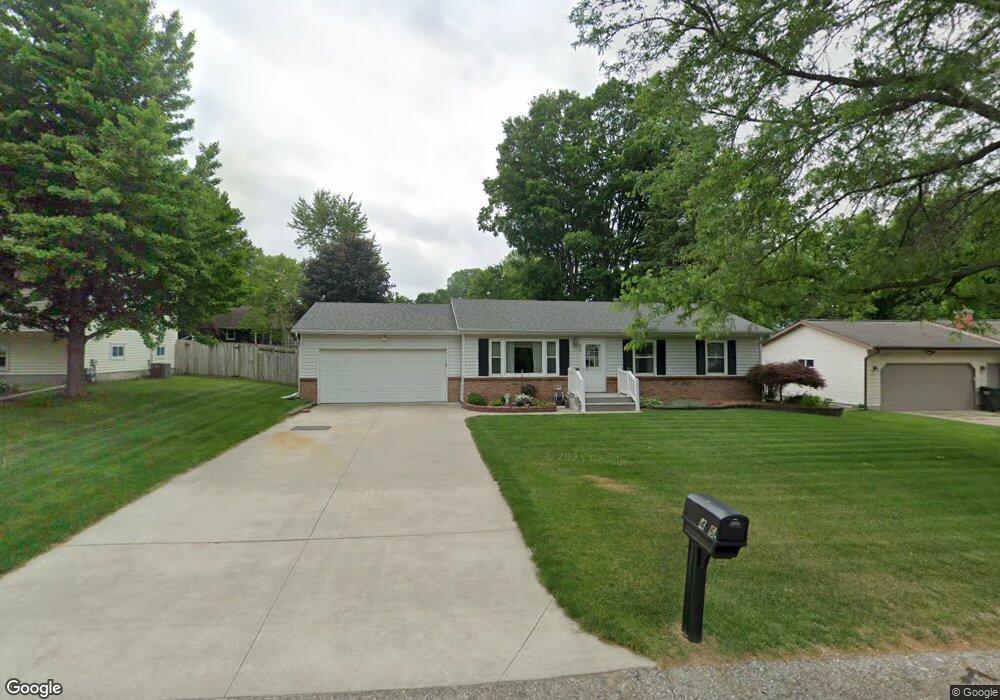
406 Anderson Dr Wayland, MI 49348
Estimated Value: $250,910 - $311,000
3
Beds
1
Bath
1,120
Sq Ft
$262/Sq Ft
Est. Value
About This Home
This home is located at 406 Anderson Dr, Wayland, MI 49348 and is currently estimated at $292,978, approximately $261 per square foot. 406 Anderson Dr is a home located in Allegan County with nearby schools including Wayland High School and St. Therese Catholic School.
Ownership History
Date
Name
Owned For
Owner Type
Purchase Details
Closed on
Aug 6, 2008
Sold by
Schwartz Maxine F
Bought by
Schwartz Maxine F and Sebright Susan
Current Estimated Value
Home Financials for this Owner
Home Financials are based on the most recent Mortgage that was taken out on this home.
Original Mortgage
$67,100
Interest Rate
6.39%
Mortgage Type
New Conventional
Purchase Details
Closed on
Aug 15, 2006
Sold by
Sytsma Douglas J and Sytsma Lisa J
Bought by
Schwartz Maxine F
Home Financials for this Owner
Home Financials are based on the most recent Mortgage that was taken out on this home.
Original Mortgage
$101,200
Outstanding Balance
$60,990
Interest Rate
6.83%
Mortgage Type
Purchase Money Mortgage
Estimated Equity
$231,988
Purchase Details
Closed on
Jun 7, 2000
Sold by
Feenstra Debra Kna Hansen
Bought by
Sytsma Douglas and Sytsma Lisa
Purchase Details
Closed on
Jun 24, 1997
Sold by
Feenstra Ricky and Feenstra Debra
Bought by
Feenstra Debra
Purchase Details
Closed on
Dec 17, 1993
Sold by
Rookus John
Bought by
Feenstra Ricky and Feenstra Debra
Create a Home Valuation Report for This Property
The Home Valuation Report is an in-depth analysis detailing your home's value as well as a comparison with similar homes in the area
Home Values in the Area
Average Home Value in this Area
Purchase History
| Date | Buyer | Sale Price | Title Company |
|---|---|---|---|
| Schwartz Maxine F | -- | None Available | |
| Schwartz Maxine F | $126,500 | Chicago Title | |
| Sytsma Douglas | $105,000 | -- | |
| Feenstra Debra | -- | -- | |
| Feenstra Ricky | $69,900 | -- |
Source: Public Records
Mortgage History
| Date | Status | Borrower | Loan Amount |
|---|---|---|---|
| Closed | Schwartz Maxine F | $67,100 | |
| Open | Schwartz Maxine F | $101,200 |
Source: Public Records
Tax History Compared to Growth
Tax History
| Year | Tax Paid | Tax Assessment Tax Assessment Total Assessment is a certain percentage of the fair market value that is determined by local assessors to be the total taxable value of land and additions on the property. | Land | Improvement |
|---|---|---|---|---|
| 2025 | $2,532 | $90,400 | $14,000 | $76,400 |
| 2024 | $2,301 | $80,200 | $11,200 | $69,000 |
| 2023 | $2,301 | $83,600 | $11,400 | $72,200 |
| 2022 | $2,301 | $74,600 | $10,400 | $64,200 |
| 2021 | $2,154 | $68,800 | $10,200 | $58,600 |
| 2020 | $2,154 | $67,100 | $10,200 | $56,900 |
| 2019 | $0 | $60,300 | $9,600 | $50,700 |
| 2018 | $0 | $55,500 | $9,600 | $45,900 |
| 2017 | $0 | $54,400 | $9,600 | $44,800 |
| 2016 | $0 | $48,200 | $9,600 | $38,600 |
| 2015 | -- | $48,200 | $9,600 | $38,600 |
| 2014 | -- | $46,600 | $11,600 | $35,000 |
| 2013 | -- | $43,700 | $11,600 | $32,100 |
Source: Public Records
Map
Nearby Homes
- 401 Anderson Dr
- 330 Lotz Ct
- 835 Wild Flower Ct
- 146 Hanlon Ct
- 212 E Superior St
- 110 E Sycamore St
- 621 S Main St
- 3282 Stonehill Ct
- 3296 Stonehill Ct
- 545 N Main St
- 319 Alpine St
- 219 Alpine St
- 3610 Garden St
- 3685 Calkins Ct
- 3770 Division Ave S
- 1143 Regina Trail
- 3570 Windsor Woods Dr
- 1149 Regina Trail
- 4674 12th St
- 3214 7th St
- 402 Anderson Dr
- 412 Anderson Dr
- 409 Standish Dr
- 415 Standish Dr
- 403 Standish Dr
- 320 Anderson Dr
- 601 Plum St
- 407 Anderson Dr
- 323 Standish Dr
- 421 Standish Dr
- 413 Anderson Dr
- 314 Anderson Dr
- 321 Anderson Dr
- 315 Anderson Dr
- 419 Anderson Dr
- 317 Standish Dr
- 310 Anderson Dr
- 408 Standish Dr
- 550 Plum St
- 425 Anderson Dr