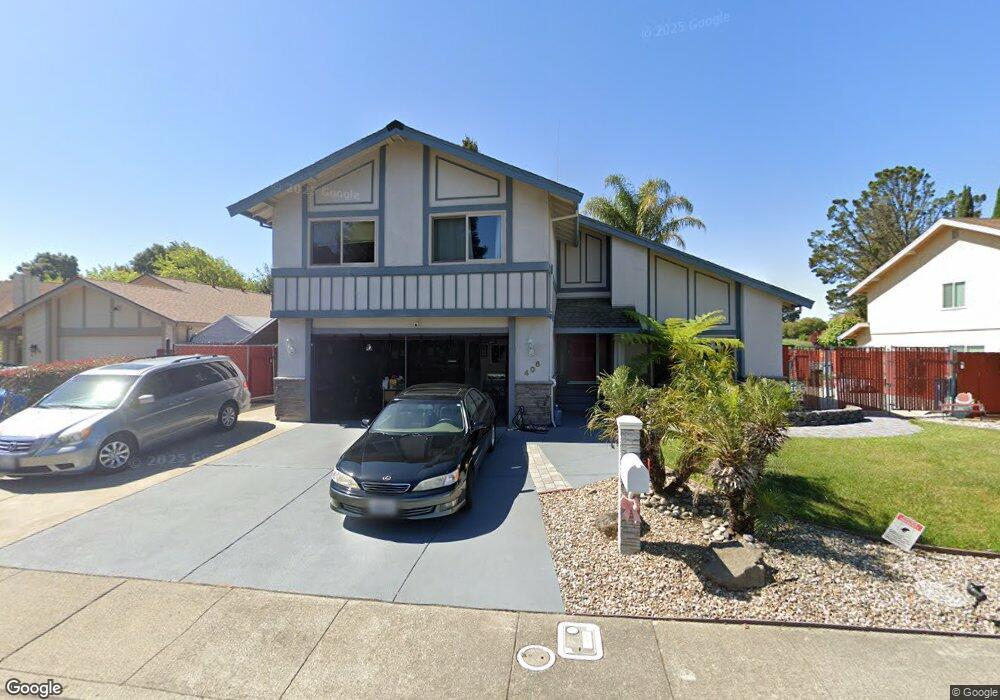
406 Duvall Ct Benicia, CA 94510
Estimated Value: $717,000 - $812,324
3
Beds
3
Baths
2,039
Sq Ft
$385/Sq Ft
Est. Value
About This Home
This home is located at 406 Duvall Ct, Benicia, CA 94510 and is currently estimated at $784,581, approximately $384 per square foot. 406 Duvall Ct is a home located in Solano County with nearby schools including Joe Henderson Elementary School, Benicia Middle School, and Benicia High School.
Ownership History
Date
Name
Owned For
Owner Type
Purchase Details
Closed on
Aug 10, 1994
Sold by
Weingast Barry J and Weingast Greta R
Bought by
Cubit Charles P and Cubit Alfreda
Current Estimated Value
Home Financials for this Owner
Home Financials are based on the most recent Mortgage that was taken out on this home.
Original Mortgage
$193,410
Outstanding Balance
$108,152
Interest Rate
8.8%
Estimated Equity
$676,429
Create a Home Valuation Report for This Property
The Home Valuation Report is an in-depth analysis detailing your home's value as well as a comparison with similar homes in the area
Home Values in the Area
Average Home Value in this Area
Purchase History
We collect this data history from publicly available records. To have your information removed, we recommend requesting removal directly through your county’s website.
| Date | Buyer | Sale Price | Title Company |
|---|---|---|---|
| Cubit Charles P | $215,000 | Placer Title Company |
Source: Public Records
Mortgage History
We collect this data history from publicly available records. To have your information removed, we recommend requesting removal directly through your county’s website.
| Date | Status | Borrower | Loan Amount |
|---|---|---|---|
| Open | Cubit Charles P | $193,410 |
Source: Public Records
Tax History
| Year | Tax Paid | Tax Assessment Tax Assessment Total Assessment is a certain percentage of the fair market value that is determined by local assessors to be the total taxable value of land and additions on the property. | Land | Improvement |
|---|---|---|---|---|
| 2025 | $4,206 | $365,540 | $109,335 | $256,205 |
| 2024 | $4,206 | $358,374 | $107,192 | $251,182 |
| 2023 | $4,104 | $351,348 | $105,091 | $246,257 |
| 2022 | $4,026 | $344,460 | $103,031 | $241,429 |
| 2021 | $3,943 | $337,707 | $101,011 | $236,696 |
| 2020 | $3,889 | $334,245 | $99,976 | $234,269 |
| 2019 | $3,820 | $327,692 | $98,016 | $229,676 |
| 2018 | $3,721 | $321,268 | $96,095 | $225,173 |
| 2017 | $3,634 | $314,969 | $94,211 | $220,758 |
| 2016 | $3,659 | $308,794 | $92,364 | $216,430 |
| 2015 | $3,565 | $304,157 | $90,977 | $213,180 |
| 2014 | $3,521 | $298,200 | $89,195 | $209,005 |
Source: Public Records
Map
Nearby Homes
- 403 Gerald Ct
- 231 Panorama Dr
- 263 Carlisle Way
- 284 Carlisle Way
- 212 Panorama Dr
- 212 Eaton Ct
- 460 Turner Dr
- 101 Panorama Dr
- 203 Radnor Ct
- 443 Greenbrier Ct
- 308 Panorama Ct
- 208 Essex Way
- 148 Chelsea Hills Dr
- 528 Laurel Ct
- 264 James Ct
- 487 Gray Ct
- 618 Rose Dr
- 164 Carlisle Way
- 538 Solano Dr
- 900 Southampton Rd Unit 140
Your Personal Tour Guide
Ask me questions while you tour the home.