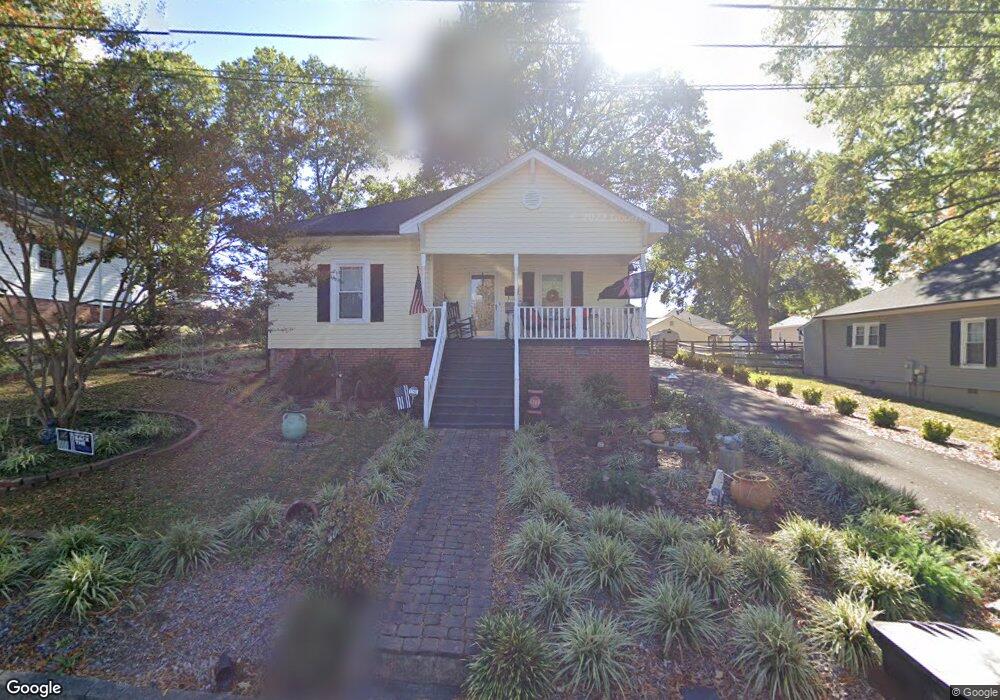
406 E 4th St Kannapolis, NC 28083
Estimated Value: $227,000 - $268,000
3
Beds
1
Bath
1,608
Sq Ft
$155/Sq Ft
Est. Value
About This Home
This home is located at 406 E 4th St, Kannapolis, NC 28083 and is currently estimated at $248,783, approximately $154 per square foot. 406 E 4th St is a home located in Cabarrus County with nearby schools including North Kannapolis Elementary School, Kannapolis Middle, and A.L. Brown High School.
Ownership History
Date
Name
Owned For
Owner Type
Purchase Details
Closed on
Dec 27, 2017
Sold by
Graham Jonathan R and Graham Delia E
Bought by
Casag N East Ave Properties Llc
Current Estimated Value
Home Financials for this Owner
Home Financials are based on the most recent Mortgage that was taken out on this home.
Original Mortgage
$146,300
Outstanding Balance
$103,281
Interest Rate
3.95%
Mortgage Type
Commercial
Estimated Equity
$145,502
Purchase Details
Closed on
Feb 1, 1994
Bought by
Hardison Rebekah K
Purchase Details
Closed on
Mar 1, 1990
Create a Home Valuation Report for This Property
The Home Valuation Report is an in-depth analysis detailing your home's value as well as a comparison with similar homes in the area
Home Values in the Area
Average Home Value in this Area
Purchase History
| Date | Buyer | Sale Price | Title Company |
|---|---|---|---|
| Casag N East Ave Properties Llc | -- | None Available | |
| Hardison Rebekah K | $70,000 | -- | |
| -- | $30,000 | -- |
Source: Public Records
Mortgage History
| Date | Status | Borrower | Loan Amount |
|---|---|---|---|
| Open | Casag N East Ave Properties Llc | $146,300 |
Source: Public Records
Tax History
| Year | Tax Paid | Tax Assessment Tax Assessment Total Assessment is a certain percentage of the fair market value that is determined by local assessors to be the total taxable value of land and additions on the property. | Land | Improvement |
|---|---|---|---|---|
| 2025 | $2,368 | $208,530 | $44,000 | $164,530 |
| 2024 | $2,368 | $208,530 | $44,000 | $164,530 |
| 2023 | $1,772 | $129,360 | $32,000 | $97,360 |
| 2022 | $0 | $124,460 | $32,000 | $92,460 |
| 2021 | $1,705 | $124,460 | $32,000 | $92,460 |
| 2020 | $1,705 | $124,460 | $32,000 | $92,460 |
| 2019 | $1,302 | $95,070 | $17,000 | $78,070 |
| 2018 | $1,283 | $95,070 | $17,000 | $78,070 |
| 2017 | $1,264 | $95,070 | $17,000 | $78,070 |
| 2016 | $1,264 | $97,090 | $23,000 | $74,090 |
| 2015 | $1,223 | $97,090 | $23,000 | $74,090 |
| 2014 | $1,223 | $97,090 | $23,000 | $74,090 |
Source: Public Records
Map
Nearby Homes
- 423 N East Ave
- 313 Wisteria Ln
- 535 Martin Luther King Junior Ave
- 541 Martin Luther King Junior Ave
- 200 Martin Luther King Junior Ave
- 606 Jackson St
- 202 Milton L Taylor St
- 207 S East Ave
- 346 Saint Joseph St
- 904 Venus St
- 704 Sloop Ave
- 303 E 10th St
- 1102 Lane St
- 911 N Walnut St
- 705 Gem St
- 704 Gem St Unit 17
- 143 Johndy Ave
- 214 E 11th St
- 208 James St
- 600 Foster St
Your Personal Tour Guide
Ask me questions while you tour the home.