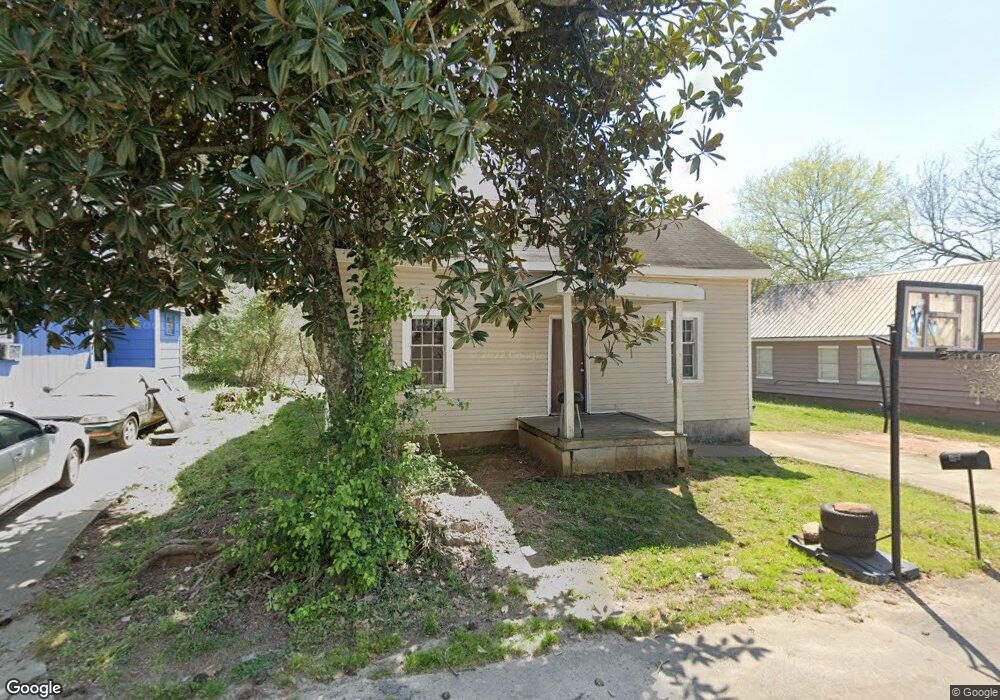
406 E Bacon St Lagrange, GA 30241
Estimated Value: $85,000 - $161,000
3
Beds
1
Bath
1,353
Sq Ft
$83/Sq Ft
Est. Value
About This Home
This home is located at 406 E Bacon St, Lagrange, GA 30241 and is currently estimated at $112,796, approximately $83 per square foot. 406 E Bacon St is a home located in Troup County with nearby schools including Franklin Forest Elementary School, Hollis Hand Elementary School, and Ethel W. Kight Elementary School.
Ownership History
Date
Name
Owned For
Owner Type
Purchase Details
Closed on
Nov 30, 2021
Sold by
T Squared 1 Llc
Bought by
Brbrshy Investments Inc
Current Estimated Value
Purchase Details
Closed on
Jun 1, 2021
Sold by
Stribling Ty
Bought by
T Squared 2 Llc
Purchase Details
Closed on
Oct 13, 2003
Sold by
Martin J Miller
Bought by
Stribling Ty
Purchase Details
Closed on
Mar 1, 2001
Sold by
Madeline Moore Tucker
Bought by
Martin J Miller
Purchase Details
Closed on
Apr 24, 1990
Sold by
Phillip Stribling
Bought by
Madeline Moore Tucker
Purchase Details
Closed on
Sep 21, 1989
Sold by
Norman Bass
Bought by
Phillip Stribling
Purchase Details
Closed on
Dec 1, 1985
Sold by
Leola Parks and Leola Strozier V
Bought by
Norman Bass
Purchase Details
Closed on
Nov 12, 1983
Sold by
Kate Bass
Bought by
Leola Parks and Leola Strozier V
Purchase Details
Closed on
Jan 1, 1968
Sold by
Bertha Rutledge
Bought by
Kate Bass
Create a Home Valuation Report for This Property
The Home Valuation Report is an in-depth analysis detailing your home's value as well as a comparison with similar homes in the area
Purchase History
| Date | Buyer | Sale Price | Title Company |
|---|---|---|---|
| Brbrshy Investments Inc | $12,484,500 | -- | |
| T Squared 2 Llc | -- | -- | |
| Stribling Ty | $1,181,000 | -- | |
| Martin J Miller | $907,500 | -- | |
| Madeline Moore Tucker | $10,000 | -- | |
| Phillip Stribling | $4,000 | -- | |
| Norman Bass | -- | -- | |
| Leola Parks | -- | -- | |
| Kate Bass | -- | -- |
Source: Public Records
Tax History
| Year | Tax Paid | Tax Assessment Tax Assessment Total Assessment is a certain percentage of the fair market value that is determined by local assessors to be the total taxable value of land and additions on the property. | Land | Improvement |
|---|---|---|---|---|
| 2025 | $944 | $34,600 | $1,240 | $33,360 |
| 2024 | $818 | $30,000 | $1,240 | $28,760 |
| 2023 | $541 | $19,840 | $1,240 | $18,600 |
| 2022 | $524 | $18,760 | $1,240 | $17,520 |
| 2021 | $229 | $7,600 | $1,240 | $6,360 |
| 2020 | $229 | $7,600 | $1,240 | $6,360 |
| 2019 | $194 | $6,440 | $960 | $5,480 |
| 2018 | $194 | $6,440 | $960 | $5,480 |
| 2017 | $194 | $6,440 | $960 | $5,480 |
| 2016 | $212 | $7,042 | $932 | $6,110 |
| 2015 | $213 | $7,042 | $932 | $6,110 |
| 2014 | $213 | $7,042 | $932 | $6,110 |
| 2013 | -- | $8,012 | $932 | $7,080 |
Source: Public Records
Map
Nearby Homes
- 131 Foch St
- 706 N Harlem Cir
- 616 S Harlem Cir
- 301 E Bacon St
- 121 de Groat St
- 622 Arthur St
- 803 1/2 Hines St
- 0 Ridley Ave Unit 10550104
- 609 Ridley Ave
- 707 Ridley Ave
- 611 Ridley Ave
- 615 Ridley Ave
- 709 Ridley Ave
- 801 Hines St
- 102 Dogwood Dr
- 101 McGee St
- 118 Highland Ave
- 208 Render St
- 228 E Render St
- 335 Laurel Ln
Your Personal Tour Guide
Ask me questions while you tour the home.