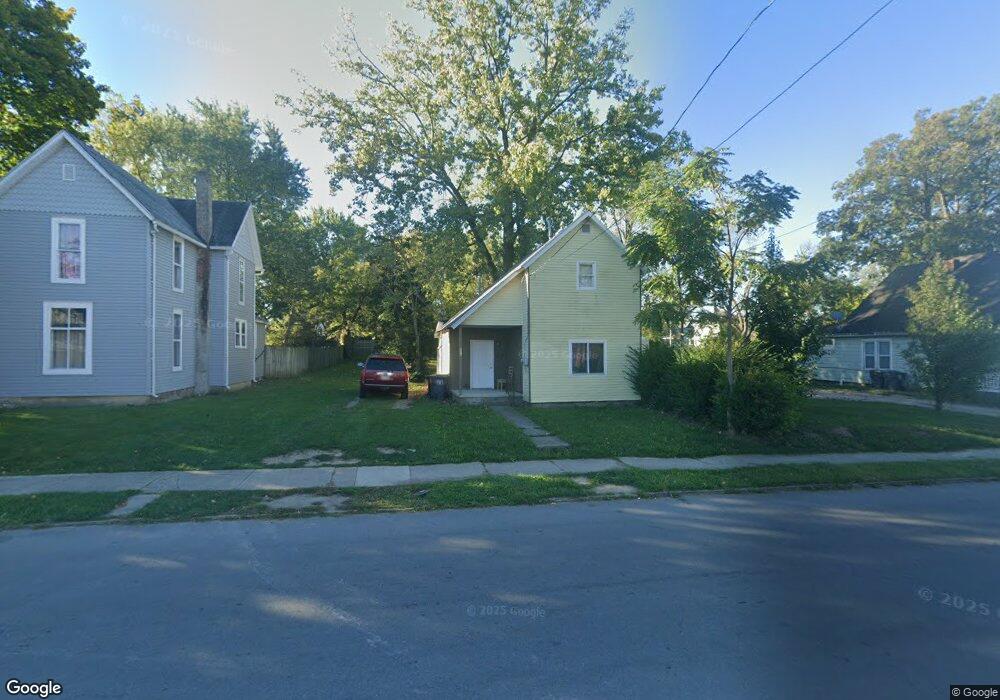
406 E Kibby St Lima, OH 45804
Fifth Ward NeighborhoodEstimated Value: $49,000 - $98,000
2
Beds
1
Bath
783
Sq Ft
$87/Sq Ft
Est. Value
About This Home
This home is located at 406 E Kibby St, Lima, OH 45804 and is currently estimated at $68,237, approximately $87 per square foot. 406 E Kibby St is a home located in Allen County with nearby schools including Freedom Elementary School, Lima North Middle School, and Lima West Middle School.
Ownership History
Date
Name
Owned For
Owner Type
Purchase Details
Closed on
Feb 21, 2017
Sold by
Patterson Hempker Angela M
Bought by
Cooks Ii Mack
Current Estimated Value
Purchase Details
Closed on
Feb 1, 2017
Sold by
Monhollen Lori R and Ratterson James T
Bought by
Patterson Hempker Angela M
Purchase Details
Closed on
May 26, 2016
Bought by
Monhollen Lori R @3
Home Financials for this Owner
Home Financials are based on the most recent Mortgage that was taken out on this home.
Interest Rate
3.64%
Purchase Details
Closed on
Aug 12, 1999
Sold by
Crouch Larry
Bought by
Lucius Peggy
Purchase Details
Closed on
Apr 22, 1999
Sold by
Manley Marlin
Bought by
Crouch Larry and Crouch Peggy Lucius
Purchase Details
Closed on
May 1, 1981
Bought by
Manley Marlin Dennis
Create a Home Valuation Report for This Property
The Home Valuation Report is an in-depth analysis detailing your home's value as well as a comparison with similar homes in the area
Home Values in the Area
Average Home Value in this Area
Purchase History
| Date | Buyer | Sale Price | Title Company |
|---|---|---|---|
| Cooks Ii Mack | $15,600 | None Available | |
| Patterson Hempker Angela M | -- | None Available | |
| Monhollen Lori R @3 | -- | -- | |
| Lucius Peggy | $9,000 | -- | |
| Crouch Larry | $15,500 | -- | |
| Manley Marlin Dennis | $19,200 | -- |
Source: Public Records
Mortgage History
| Date | Status | Borrower | Loan Amount |
|---|---|---|---|
| Previous Owner | Monhollen Lori R @3 | -- |
Source: Public Records
Tax History
| Year | Tax Paid | Tax Assessment Tax Assessment Total Assessment is a certain percentage of the fair market value that is determined by local assessors to be the total taxable value of land and additions on the property. | Land | Improvement |
|---|---|---|---|---|
| 2024 | $283 | $6,130 | $670 | $5,460 |
| 2023 | $353 | $5,850 | $630 | $5,220 |
| 2022 | $353 | $5,850 | $630 | $5,220 |
| 2021 | $317 | $5,850 | $630 | $5,220 |
| 2020 | $380 | $5,460 | $630 | $4,830 |
| 2019 | $380 | $5,460 | $630 | $4,830 |
| 2018 | $469 | $5,460 | $630 | $4,830 |
| 2017 | $330 | $5,460 | $630 | $4,830 |
| 2016 | $1,171 | $5,460 | $630 | $4,830 |
| 2015 | $443 | $5,460 | $630 | $4,830 |
| 2014 | $443 | $6,550 | $670 | $5,880 |
| 2013 | $383 | $6,550 | $670 | $5,880 |
Source: Public Records
Map
Nearby Homes
- 544 S Pine St
- 818 Madison Ave
- 706 E Kibby St
- 471 Mc Pheron Ave
- 653 S Scott St
- 0 E Vine St
- 546 Orena Ave
- 717 E Kibby St
- 520 Orena Ave
- 712 S Elizabeth St
- 629 Harrison Ave
- 725 E Vine St
- 801 E Vine St
- 621 Prospect Ave
- 610 Linden St
- 812 E Vine St
- 817 E Eureka St
- 915 Michael Ave
- 626 E Elm St
- 145 S Pine St
Your Personal Tour Guide
Ask me questions while you tour the home.