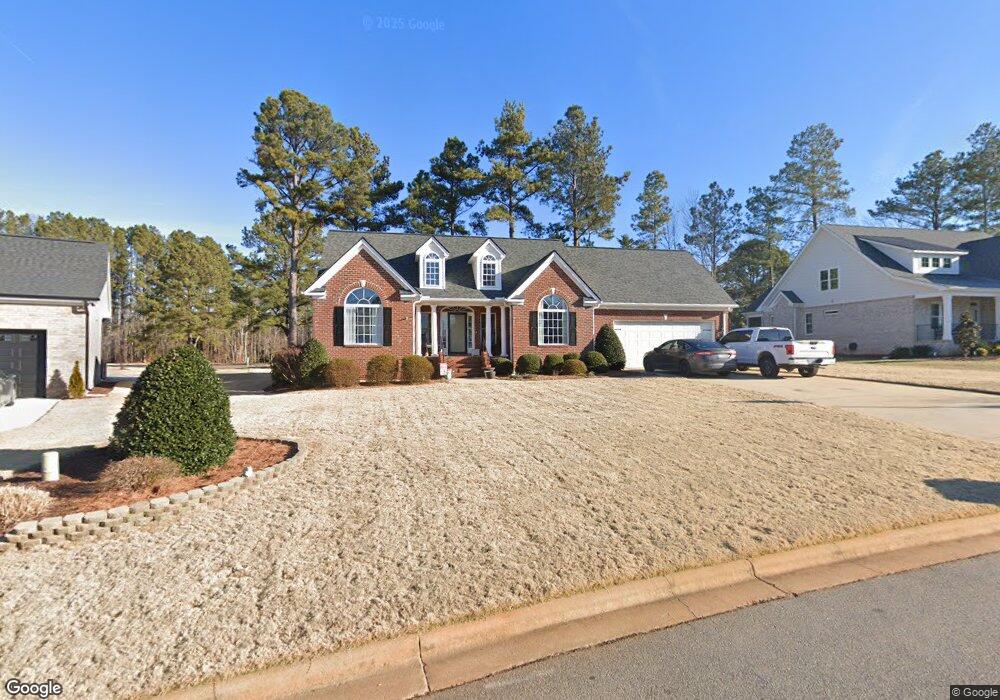
406 Eagle Ct Henderson, NC 27536
Estimated Value: $341,718 - $432,000
3
Beds
2
Baths
2,183
Sq Ft
$178/Sq Ft
Est. Value
About This Home
This home is located at 406 Eagle Ct, Henderson, NC 27536 and is currently estimated at $388,430, approximately $177 per square foot. 406 Eagle Ct is a home located in Vance County with nearby schools including E.M. Rollins Elementary School, Vance County High School, and Vance Charter School.
Ownership History
Date
Name
Owned For
Owner Type
Purchase Details
Closed on
Nov 1, 2017
Sold by
Sanchez Eric E and Sanchez Carice C
Bought by
Peoples Michael D and Peoples Lisa P
Current Estimated Value
Home Financials for this Owner
Home Financials are based on the most recent Mortgage that was taken out on this home.
Original Mortgage
$218,000
Outstanding Balance
$186,261
Interest Rate
4.62%
Mortgage Type
Adjustable Rate Mortgage/ARM
Estimated Equity
$202,169
Purchase Details
Closed on
Jan 28, 2011
Sold by
Freeman Kevin Richard and Freeman Jonathan Richard
Bought by
Sanchez Eric E and Sanchez Carice C
Home Financials for this Owner
Home Financials are based on the most recent Mortgage that was taken out on this home.
Original Mortgage
$212,473
Interest Rate
4.82%
Mortgage Type
FHA
Purchase Details
Closed on
Oct 3, 2006
Sold by
Childress Betty R
Bought by
Freeman Kevin Richard
Create a Home Valuation Report for This Property
The Home Valuation Report is an in-depth analysis detailing your home's value as well as a comparison with similar homes in the area
Purchase History
| Date | Buyer | Sale Price | Title Company |
|---|---|---|---|
| Peoples Michael D | $218,000 | None Available | |
| Sanchez Eric E | $218,000 | -- | |
| Freeman Kevin Richard | $269,000 | -- |
Source: Public Records
Mortgage History
| Date | Status | Borrower | Loan Amount |
|---|---|---|---|
| Open | Peoples Michael D | $218,000 | |
| Previous Owner | Sanchez Eric E | $212,473 |
Source: Public Records
Tax History
| Year | Tax Paid | Tax Assessment Tax Assessment Total Assessment is a certain percentage of the fair market value that is determined by local assessors to be the total taxable value of land and additions on the property. | Land | Improvement |
|---|---|---|---|---|
| 2025 | $4,469 | $317,175 | $16,200 | $300,975 |
| 2024 | $4,448 | $317,175 | $16,200 | $300,975 |
| 2023 | $4,350 | $257,916 | $35,000 | $222,916 |
| 2022 | $4,252 | $257,916 | $35,000 | $222,916 |
| 2021 | $4,132 | $257,916 | $35,000 | $222,916 |
| 2020 | $4,249 | $257,916 | $35,000 | $222,916 |
| 2019 | $4,244 | $257,916 | $35,000 | $222,916 |
| 2018 | $4,132 | $257,916 | $35,000 | $222,916 |
| 2017 | $4,237 | $257,916 | $35,000 | $222,916 |
| 2016 | $4,237 | $257,916 | $35,000 | $222,916 |
| 2015 | $3,850 | $267,490 | $40,000 | $227,490 |
| 2014 | $3,882 | $267,494 | $40,000 | $227,494 |
Source: Public Records
Map
Nearby Homes
- 204 Par Dr
- 1806 Waddill Way
- 1630 Ruin Creek Rd
- 1822 Ruin Creek Rd
- Lot 5 Sidney Hill
- 2535 Fairway Dr Unit 3
- 1612 Lynne Ave
- 119 Deer Wood Trail
- 1105 Dabney Dr
- 206 Beechwood Trail
- 1220 Roanoke Ave
- 1204 Roanoke Ave
- 1408 Parker Ln
- 1540 Cypress Dr
- 126 White Oak Dr
- 131 White Oak Dr
- 314 Willowood Dr
- 860 Nelson St
- 00 Oxford Rd Southern Ave Rd
- 802 Roanoke Ave
- 101 Eagle Ct
- Lot 18 Eagle Ct
- 0 Eagle Ct Unit 1799669
- 0 Eagle Ct Unit 1799664
- 0 Eagle Ct Unit 1799674
- 0 Eagle Ct Unit TR2188663
- 0 Eagle Ct Unit 14 1799674
- 0 Eagle Ct Unit 18 1799664
- 0 Eagle Ct Unit 15 1799669
- Lot 18 Eagle Ct Unit 18
- Lot 15 Eagle Ct Unit 15
- Lot 14 Eagle Ct Unit 14
- Lot 15 Eagle Ct
- Lot 14 Eagle Ct
- 0 Eagle Ct
- 0000 Eagle Ct
- 000 Eagle Ct
- 4 Eagle Ct
- 3 Eagle Ct
- 00 Eagle Ct
Your Personal Tour Guide
Ask me questions while you tour the home.