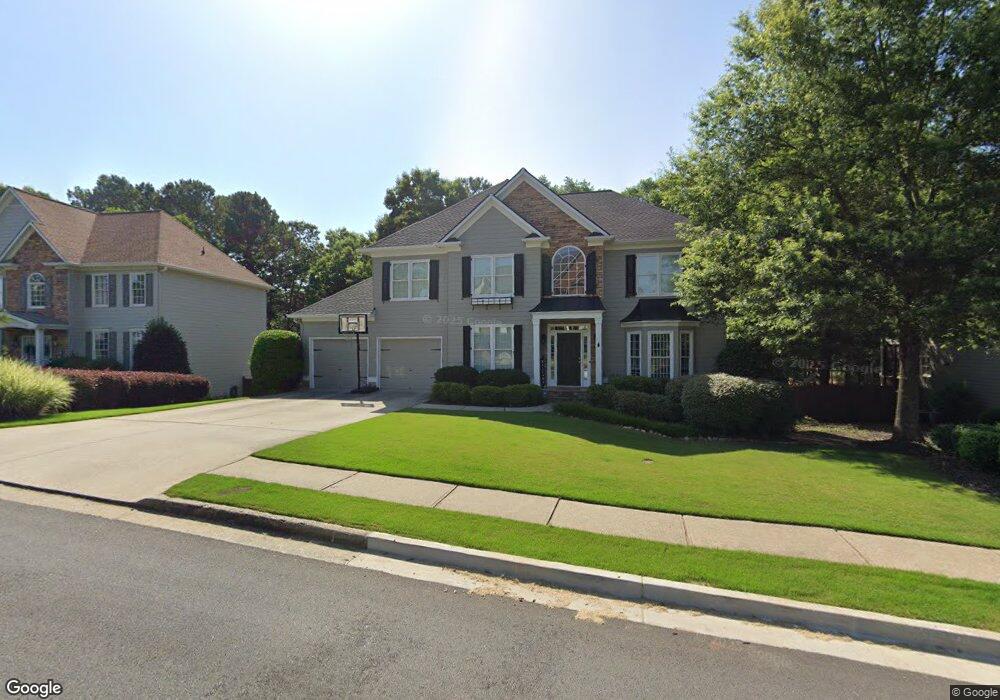
406 Lake Point Trace Canton, GA 30114
Sutallee NeighborhoodEstimated Value: $785,000
4
Beds
3
Baths
3,088
Sq Ft
$254/Sq Ft
Est. Value
About This Home
This home is located at 406 Lake Point Trace, Canton, GA 30114 and is currently estimated at $785,000, approximately $254 per square foot. 406 Lake Point Trace is a home located in Cherokee County with nearby schools including Liberty Elementary School, Freedom Middle School, and Cherokee High School.
Ownership History
Date
Name
Owned For
Owner Type
Purchase Details
Closed on
Sep 1, 2010
Sold by
Dearman Jim and Dearman Rebecca
Bought by
Dilling Adam B and Dilling Elisabeth
Current Estimated Value
Home Financials for this Owner
Home Financials are based on the most recent Mortgage that was taken out on this home.
Original Mortgage
$283,500
Outstanding Balance
$187,256
Interest Rate
4.6%
Mortgage Type
New Conventional
Estimated Equity
$597,744
Purchase Details
Closed on
Oct 10, 2002
Sold by
Oglilvie Custom Hm Builders Inc
Bought by
Dearman Jim and Dearman Rebecca
Home Financials for this Owner
Home Financials are based on the most recent Mortgage that was taken out on this home.
Original Mortgage
$33,288
Interest Rate
6.18%
Mortgage Type
New Conventional
Create a Home Valuation Report for This Property
The Home Valuation Report is an in-depth analysis detailing your home's value as well as a comparison with similar homes in the area
Home Values in the Area
Average Home Value in this Area
Purchase History
| Date | Buyer | Sale Price | Title Company |
|---|---|---|---|
| Dilling Adam B | $315,000 | -- | |
| Dearman Jim | $332,900 | -- |
Source: Public Records
Mortgage History
| Date | Status | Borrower | Loan Amount |
|---|---|---|---|
| Open | Dilling Adam B | $283,500 | |
| Previous Owner | Dearman Jim | $33,288 | |
| Previous Owner | Dearman Jim | $266,311 |
Source: Public Records
Tax History
| Year | Tax Paid | Tax Assessment Tax Assessment Total Assessment is a certain percentage of the fair market value that is determined by local assessors to be the total taxable value of land and additions on the property. | Land | Improvement |
|---|---|---|---|---|
| 2025 | $5,997 | $261,476 | $52,000 | $209,476 |
| 2024 | $5,833 | $251,200 | $48,000 | $203,200 |
| 2023 | $4,923 | $231,600 | $48,000 | $183,600 |
| 2022 | $4,662 | $195,920 | $38,800 | $157,120 |
| 2021 | $4,311 | $164,000 | $31,600 | $132,400 |
| 2020 | $4,077 | $153,760 | $31,600 | $122,160 |
| 2019 | $3,872 | $144,920 | $31,600 | $113,320 |
| 2018 | $3,690 | $136,320 | $30,000 | $106,320 |
| 2017 | $3,675 | $336,300 | $30,000 | $104,520 |
| 2016 | $3,557 | $320,100 | $30,000 | $98,040 |
| 2015 | $3,438 | $304,000 | $30,000 | $91,600 |
| 2014 | $3,369 | $296,000 | $30,000 | $88,400 |
Source: Public Records
Map
Nearby Homes
- 523 Waterside Ct
- 525 Waterside Ct
- 1375 Bridgemill Ave
- 328 Lakebridge Crossing
- 101 Cedar Woods Trail
- 3020 Woodbridge Ln
- 235 Elmbrook Ln
- 511 Highwater Pass
- 227 Elmbrook Ln Unit 3L
- 601 Shelter Cove
- 5213 Millwood Dr Unit 4G
- 111 Stonegate Ln Unit 35
- 205 Gold Point Place
- 140 Stonegate Ln
- 9764 Bells Ferry Rd
- 191 Brookwood Dr
- 413 Arrowhead Trail Unit 4D
- 645 Mile Branch Rd
- 230 Gold Valley Crossing Unit 4F
- 803 Rocky Ridge Ct
- 404 Lakepoint Trace
- 404 Lake Point Trace Unit 3E
- 408 Lake Point Trace
- 410 Lake Point Trace Unit 3J
- 501 Lakewood Ct Unit 3J
- 407 Lake Point Trace Unit 3E
- 412 Lake Point Trace
- 503 Lakewood Ct Unit 3J
- 306 Lakebridge Crossing
- 500 Lakewood Ct
- 308 Lakebridge Crossing
- 405 Lake Point Trace Unit 3E
- 304 Lakebridge Crossing
- 414 Lake Point Trace Unit 3J
- 502 Lakewood Ct
- 505 Lakewood Ct
- 403 Lake Point Trace Unit 3E
- 302 Lakebridge Crossing
- 415 Lake Point Trace Unit 3J
- 1361 Bridge Mill Ave Unit 3D
Your Personal Tour Guide
Ask me questions while you tour the home.