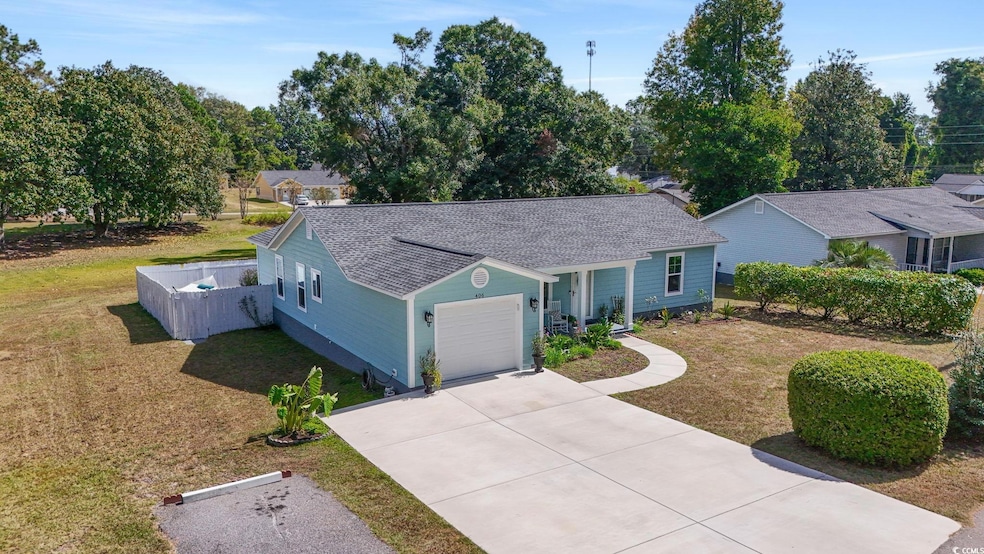
406 Maulden St Conway, SC 29527
Estimated payment $1,521/month
Highlights
- Vaulted Ceiling
- Traditional Architecture
- Stainless Steel Appliances
- Waccamaw Elementary School Rated A-
- Solid Surface Countertops
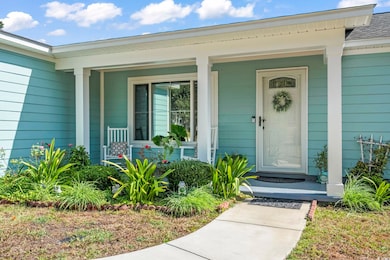
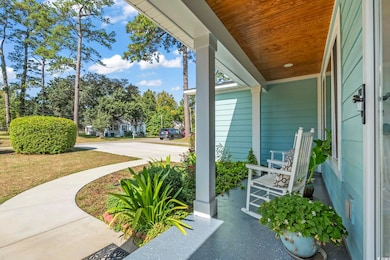
- Front Porch
About This Home
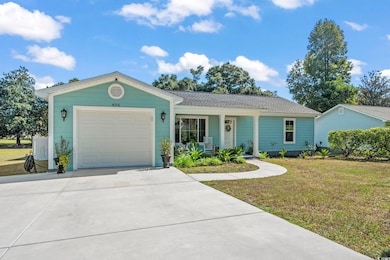
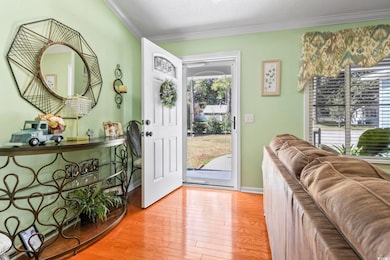
Discover this immaculate 3-bedroom, 2-bath home nestled in the heart of historic Conway, SC. With Hardie plank siding, stunning curb appeal, and an oversized concrete driveway, this home is built to impress. Inside, you’ll find a spacious and inviting floor plan, thoughtfully upgraded for modern living while still capturing the charm of downtown Conway. Every detail has been meticulously maintained, making this property truly move-in ready.
Home Details
Home Type
- Single Family
Est. Annual Taxes
- $519
Year Built
- Built in 1998
Lot Details
- 8,276 Sq Ft Lot
- Fenced
- Rectangular Lot
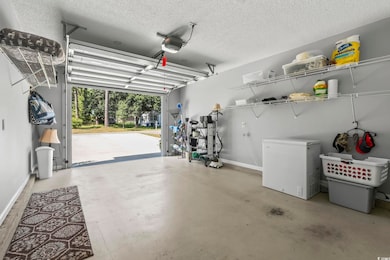
Parking
- 1 Car Attached Garage
- Garage Door Opener
Home Design
- Traditional Architecture
- Slab Foundation
- Siding
- Tile
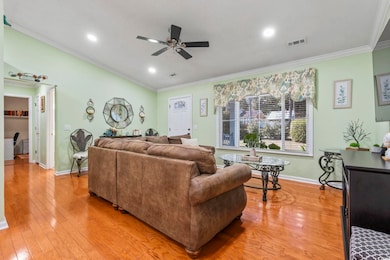
Interior Spaces
- 1,363 Sq Ft Home
- Vaulted Ceiling
- Ceiling Fan
- Dining Area
- Fire and Smoke Detector
- Washer and Dryer Hookup
Kitchen
- Range with Range Hood
- Microwave
- Dishwasher
- Stainless Steel Appliances
- Kitchen Island
- Solid Surface Countertops
- Disposal
Bedrooms and Bathrooms
- 3 Bedrooms
- 2 Full Bathrooms
Outdoor Features
- Patio
- Front Porch
Schools
- Waccamaw Elementary School
- Black Water Middle School
- Carolina Forest High School
Utilities
- Central Heating
- Water Heater
- Cable TV Available
Community Details
- The community has rules related to fencing
Map
Home Values in the Area
Average Home Value in this Area
Tax History
| Year | Tax Paid | Tax Assessment Tax Assessment Total Assessment is a certain percentage of the fair market value that is determined by local assessors to be the total taxable value of land and additions on the property. | Land | Improvement |
|---|---|---|---|---|
| 2024 | $519 | $8,481 | $1,733 | $6,748 |
| 2023 | $519 | $2,870 | $666 | $2,204 |
| 2021 | $419 | $5,510 | $666 | $4,844 |
| 2020 | $392 | $5,510 | $666 | $4,844 |
| 2019 | $392 | $5,510 | $666 | $4,844 |
| 2018 | $0 | $2,496 | $740 | $1,756 |
| 2017 | $362 | $2,496 | $740 | $1,756 |
| 2016 | -- | $2,496 | $740 | $1,756 |
| 2015 | $362 | $2,497 | $741 | $1,756 |
| 2014 | $344 | $2,497 | $741 | $1,756 |
Property History
| Date | Event | Price | List to Sale | Price per Sq Ft |
|---|---|---|---|---|
| 10/22/2025 10/22/25 | Price Changed | $279,900 | -1.8% | $205 / Sq Ft |
| 10/08/2025 10/08/25 | Price Changed | $284,900 | -3.4% | $209 / Sq Ft |
| 09/30/2025 09/30/25 | For Sale | $294,900 | -- | $216 / Sq Ft |
Purchase History
| Date | Type | Sale Price | Title Company |
|---|---|---|---|
| Quit Claim Deed | -- | -- | |
| Deed | -- | -- | |
| Deed | $115,000 | None Available | |
| Interfamily Deed Transfer | -- | None Available | |
| Warranty Deed | $87,200 | -- |
Mortgage History
| Date | Status | Loan Amount | Loan Type |
|---|---|---|---|
| Previous Owner | $115,000 | Purchase Money Mortgage | |
| Previous Owner | $87,200 | Purchase Money Mortgage |
Source: Coastal Carolinas Association of REALTORS®
MLS Number: 2523796
APN: 36806010024
Disclaimer: Certain information contained herein is derived from information provided by parties other than Homes.com. All information provided is deemed reliable, but is not guaranteed to be accurate and should be independently verified.
![]() Provided courtesy of the Coastal Carolinas MLS. Copyright 2025 of the Coastal Carolinas MLS. All rights reserved. Information is provided exclusively for consumers' personal, non-commercial use, and may not be used for any purpose other than to identify prospective properties consumers may be interested in purchasing, and that the data is deemed reliable but is not guaranteed accurate by the Coastal Carolinas MLS.
Provided courtesy of the Coastal Carolinas MLS. Copyright 2025 of the Coastal Carolinas MLS. All rights reserved. Information is provided exclusively for consumers' personal, non-commercial use, and may not be used for any purpose other than to identify prospective properties consumers may be interested in purchasing, and that the data is deemed reliable but is not guaranteed accurate by the Coastal Carolinas MLS.
- 351 Myrtle St Unit 413D
- 338 Myrtle St Unit 463D
- 354 Myrtle St Unit 469C
- 352 Myrtle St Unit 469B
- 336 Myrtle St Unit 463C
- 391 Myrtle St Unit 421B
- 393 Myrtle St Unit 421A
- 340 Myrtle St Unit 463E
- 337 Myrtle St Unit 407F
- 341 Myrtle St Unit 407D
- 339 Myrtle St Unit 407E
- 356 Myrtle St Unit 469D
- 322 Myrtle St Unit 459C
- 347 Myrtle St Unit 407A
- 342 Myrtle St Unit 463F
- 355 Myrtle St Unit 413C
- 343 Myrtle St Unit 407C
- 350 Myrtle St Unit 469A
- 359 Myrtle St Unit 413A
- 345 Myrtle St Unit 407B
- 453 Thompson St Unit NA
- 2407 James St Unit 302
- 1517 Tinkertown Ave Unit B
- 105 Clover Walk Dr
- TBD 16th Ave Unit adjacent to United C
- 1245 Pineridge St
- 3410 Longwood Ln
- 1801 Ernest Finney Ave
- 2600 Mercer Dr
- 1056 Moen Loop Unit Lot 15
- 1060 Moen Loop Unit Lot 16
- 1064 Moen Loop Unit Lot 17
- 1068 Moen Loop Unit Lot 18
- 1072 Moen Loop Unit Lot 19
- 1076 Moen Loop Unit Lot 20
- 1016 Moen Loop Unit Lot 5
- 2839 Green Pond Cir
- 1301 American Shad St
- 319-323 Honeystone St
- TBD Highway 544 Unit corner of Buccaneers
