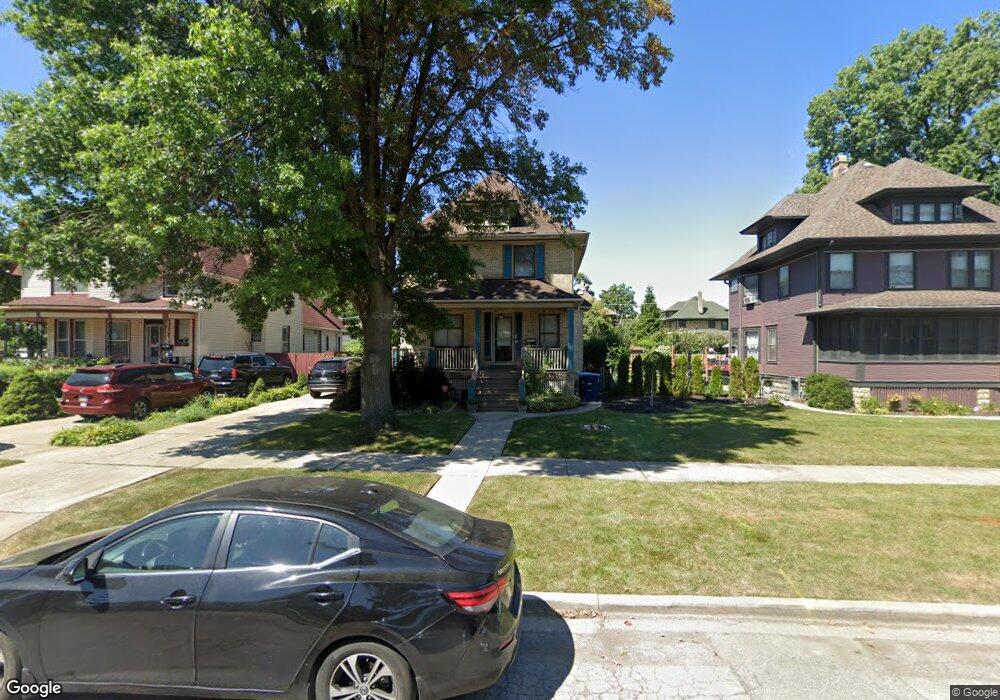
406 N 3rd Ave Maywood, IL 60153
North Maywood NeighborhoodEstimated Value: $315,000 - $413,000
5
Beds
3
Baths
1,966
Sq Ft
$179/Sq Ft
Est. Value
About This Home
This home is located at 406 N 3rd Ave, Maywood, IL 60153 and is currently estimated at $351,364, approximately $178 per square foot. 406 N 3rd Ave is a home located in Cook County with nearby schools including Lincoln Elementary School, Stevenson Middle School, and Proviso East High School.
Ownership History
Date
Name
Owned For
Owner Type
Purchase Details
Closed on
Oct 5, 2017
Sold by
Jennison Laura and Chervenka Laura
Bought by
Weisberg Amy K
Current Estimated Value
Home Financials for this Owner
Home Financials are based on the most recent Mortgage that was taken out on this home.
Original Mortgage
$235,653
Outstanding Balance
$195,771
Interest Rate
3.62%
Mortgage Type
FHA
Estimated Equity
$155,593
Purchase Details
Closed on
May 20, 2009
Sold by
Husmann Benjamin
Bought by
Chervenka Laura
Purchase Details
Closed on
May 25, 2005
Sold by
Kiger Huff Gary J and Kiger Huff Carrie
Bought by
Husmann Benjamin C and Husmann Laura A
Home Financials for this Owner
Home Financials are based on the most recent Mortgage that was taken out on this home.
Original Mortgage
$212,000
Interest Rate
5.82%
Mortgage Type
Fannie Mae Freddie Mac
Create a Home Valuation Report for This Property
The Home Valuation Report is an in-depth analysis detailing your home's value as well as a comparison with similar homes in the area
Home Values in the Area
Average Home Value in this Area
Purchase History
| Date | Buyer | Sale Price | Title Company |
|---|---|---|---|
| Weisberg Amy K | $240,000 | Heritage Title Company | |
| Chervenka Laura | -- | None Available | |
| Husmann Benjamin C | $265,000 | Multiple |
Source: Public Records
Mortgage History
| Date | Status | Borrower | Loan Amount |
|---|---|---|---|
| Open | Weisberg Amy K | $235,653 | |
| Previous Owner | Husmann Benjamin C | $212,000 |
Source: Public Records
Tax History Compared to Growth
Tax History
| Year | Tax Paid | Tax Assessment Tax Assessment Total Assessment is a certain percentage of the fair market value that is determined by local assessors to be the total taxable value of land and additions on the property. | Land | Improvement |
|---|---|---|---|---|
| 2024 | $10,204 | $27,001 | $3,141 | $23,860 |
| 2023 | $7,125 | $27,001 | $3,141 | $23,860 |
| 2022 | $7,125 | $16,076 | $2,712 | $13,364 |
| 2021 | $7,204 | $16,075 | $2,712 | $13,363 |
| 2020 | $7,150 | $16,075 | $2,712 | $13,363 |
| 2019 | $7,690 | $15,600 | $2,426 | $13,174 |
| 2018 | $9,589 | $15,600 | $2,426 | $13,174 |
| 2017 | $7,261 | $15,600 | $2,426 | $13,174 |
| 2016 | $5,554 | $11,440 | $2,141 | $9,299 |
| 2015 | $5,104 | $11,440 | $2,141 | $9,299 |
| 2014 | $4,696 | $11,440 | $2,141 | $9,299 |
| 2013 | $6,677 | $16,433 | $2,141 | $14,292 |
Source: Public Records
Map
Nearby Homes