Estimated Value: $229,730 - $276,000
--
Bed
3
Baths
1,840
Sq Ft
$139/Sq Ft
Est. Value
About This Home
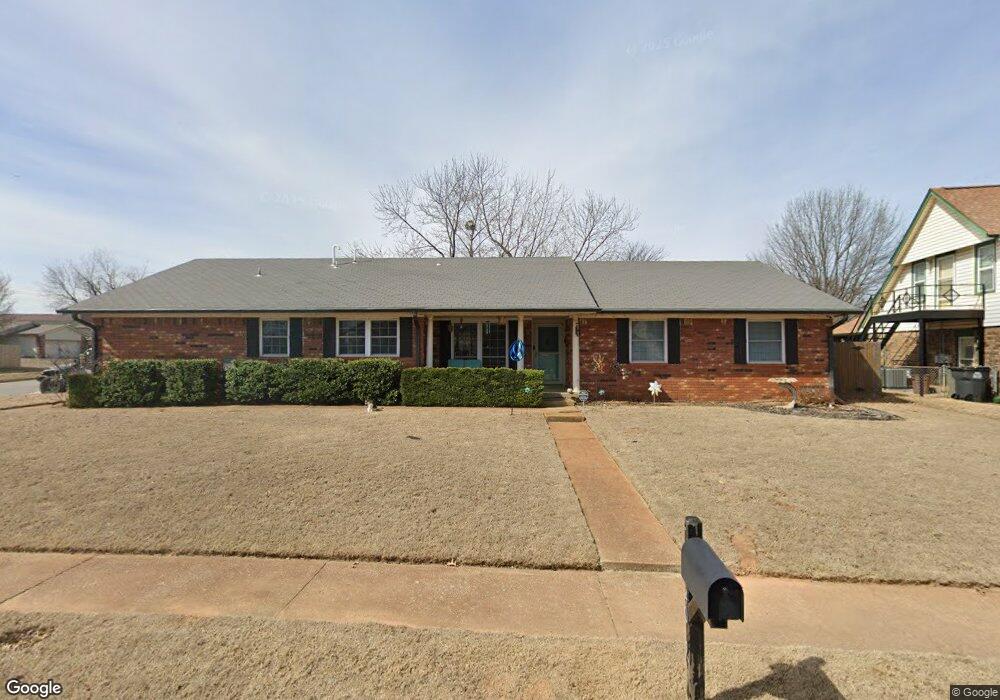
This home is located at 406 N Fir St, Jenks, OK 74037 and is currently estimated at $255,183, approximately $138 per square foot. 406 N Fir St is a home located in Tulsa County with nearby schools including Jenks West Elementary School, Jenks West Intermediate Elementary School, and Jenks Middle School.
Ownership History
Date
Name
Owned For
Owner Type
Purchase Details
Closed on
Jun 17, 2010
Sold by
Franz Norma Lee
Bought by
Bebee Kevin D and Bebee Amanda M
Current Estimated Value
Home Financials for this Owner
Home Financials are based on the most recent Mortgage that was taken out on this home.
Original Mortgage
$133,281
Outstanding Balance
$88,488
Interest Rate
4.78%
Mortgage Type
FHA
Estimated Equity
$166,695
Purchase Details
Closed on
Aug 23, 2000
Sold by
Grippando Jeffrey K and Grippando Kelly L
Bought by
Simpson Glata B
Purchase Details
Closed on
Jul 1, 1986
Create a Home Valuation Report for This Property
The Home Valuation Report is an in-depth analysis detailing your home's value as well as a comparison with similar homes in the area
Home Values in the Area
Average Home Value in this Area
Purchase History
| Date | Buyer | Sale Price | Title Company |
|---|---|---|---|
| Bebee Kevin D | $135,000 | Oklahoma Reo Closing & Title | |
| Simpson Glata B | $115,000 | Delta Title & Escrow | |
| -- | $79,000 | -- |
Source: Public Records
Mortgage History
| Date | Status | Borrower | Loan Amount |
|---|---|---|---|
| Open | Bebee Kevin D | $133,281 |
Source: Public Records
Tax History Compared to Growth
Tax History
| Year | Tax Paid | Tax Assessment Tax Assessment Total Assessment is a certain percentage of the fair market value that is determined by local assessors to be the total taxable value of land and additions on the property. | Land | Improvement |
|---|---|---|---|---|
| 2024 | $2,177 | $17,640 | $1,995 | $15,645 |
| 2023 | $2,177 | $18,097 | $2,226 | $15,871 |
| 2022 | $2,130 | $16,569 | $2,509 | $14,060 |
| 2021 | $2,091 | $16,058 | $2,432 | $13,626 |
| 2020 | $1,982 | $15,561 | $2,357 | $13,204 |
| 2019 | $1,933 | $15,079 | $2,284 | $12,795 |
| 2018 | $1,905 | $14,755 | $2,235 | $12,520 |
| 2017 | $1,815 | $15,295 | $2,316 | $12,979 |
| 2016 | $1,802 | $14,850 | $2,332 | $12,518 |
| 2015 | $1,836 | $14,850 | $2,332 | $12,518 |
| 2014 | $1,878 | $14,850 | $2,332 | $12,518 |
Source: Public Records
Map
Nearby Homes
- 422 N Forest St
- 513 W C St
- 533 N Forest St
- 927 W J St
- 1012 N Forest Place
- 649 W 101st Place S
- 0 W 101st Place S
- 108 W K Place
- 208 E Beaver St
- 149 W L St
- 504 E B St Unit G
- 9340 S Elwood Ave
- 9402 S Elwood
- 0 Aquarium Dr
- 13099 S Harvard
- 2105 W F Ct
- 2102 W J St
- 10604 S Holley St
- 9726 S Houston Ave
- 10625 S Forest Ave