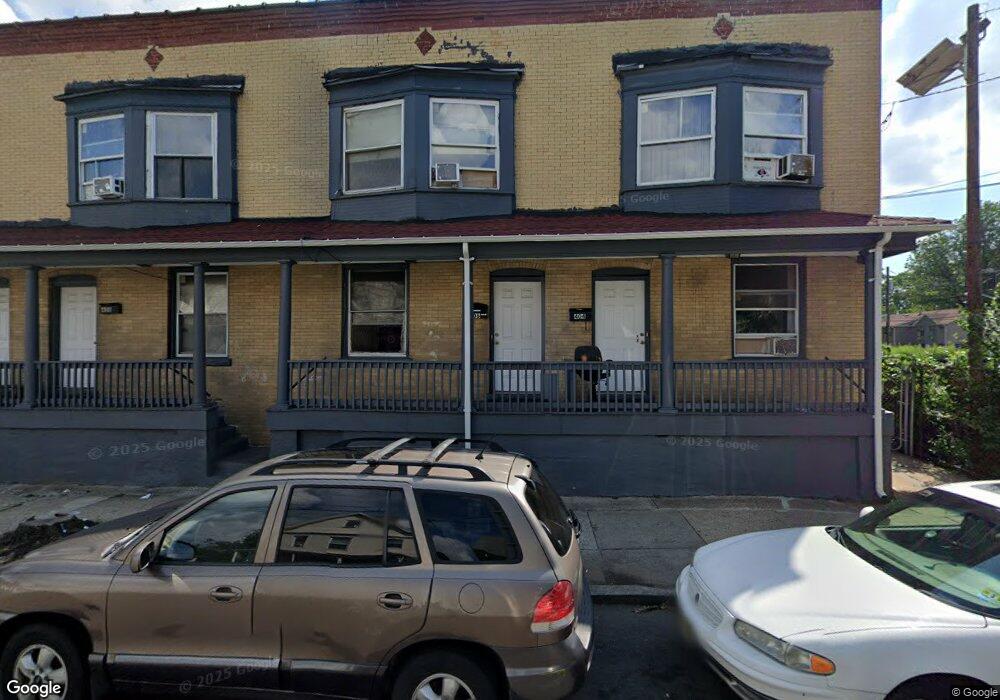
406 New St Unit 10 Plainfield, NJ 07060
Estimated Value: $432,000 - $825,000
--
Bed
--
Bath
4,998
Sq Ft
$130/Sq Ft
Est. Value
About This Home
This home is located at 406 New St Unit 10, Plainfield, NJ 07060 and is currently estimated at $647,900, approximately $129 per square foot. 406 New St Unit 10 is a home located in Union County with nearby schools including Charles H. Stillman Elementary School, Hubbard Middle School, and Plainfield High School.
Ownership History
Date
Name
Owned For
Owner Type
Purchase Details
Closed on
Oct 20, 2020
Sold by
406 New Street Llc
Bought by
Dream Properties Trust
Current Estimated Value
Purchase Details
Closed on
May 17, 2018
Sold by
Brobbey Charles
Bought by
406 New St Llc
Purchase Details
Closed on
Apr 1, 2001
Sold by
Chappaqua Development Llc
Bought by
Brobbey Charles
Home Financials for this Owner
Home Financials are based on the most recent Mortgage that was taken out on this home.
Original Mortgage
$87,500
Interest Rate
6.88%
Purchase Details
Closed on
Dec 28, 2000
Sold by
Chase Manhattan Mtg Corp
Bought by
Chappaqua Development Llc
Purchase Details
Closed on
Dec 14, 2000
Sold by
Federal Home Loan Mortgage Corporation
Bought by
Chase Manhattan Mtg Corp
Create a Home Valuation Report for This Property
The Home Valuation Report is an in-depth analysis detailing your home's value as well as a comparison with similar homes in the area
Home Values in the Area
Average Home Value in this Area
Purchase History
| Date | Buyer | Sale Price | Title Company |
|---|---|---|---|
| Dream Properties Trust | -- | Fidelity National Title | |
| Dream Properties Trust | -- | Fidelity National Title | |
| 406 New St Llc | $240,000 | Fidelity Natl Title Ins Co | |
| Brobbey Charles | $125,000 | Chicago Title Insurance Co | |
| Chappaqua Development Llc | $105,000 | First American Title Ins Co | |
| Chase Manhattan Mtg Corp | -- | First American Title Ins Co |
Source: Public Records
Mortgage History
| Date | Status | Borrower | Loan Amount |
|---|---|---|---|
| Previous Owner | Brobbey Charles | $87,500 |
Source: Public Records
Tax History Compared to Growth
Tax History
| Year | Tax Paid | Tax Assessment Tax Assessment Total Assessment is a certain percentage of the fair market value that is determined by local assessors to be the total taxable value of land and additions on the property. | Land | Improvement |
|---|---|---|---|---|
| 2025 | $11,352 | $130,000 | $33,900 | $96,100 |
| 2024 | $11,240 | $130,000 | $33,900 | $96,100 |
| 2023 | $11,240 | $130,000 | $33,900 | $96,100 |
| 2022 | $10,997 | $130,000 | $33,900 | $96,100 |
| 2021 | $10,901 | $130,000 | $33,900 | $96,100 |
| 2020 | $11,923 | $142,600 | $33,900 | $108,700 |
| 2019 | $11,923 | $142,600 | $33,900 | $108,700 |
| 2018 | $11,673 | $142,600 | $33,900 | $108,700 |
| 2017 | $11,388 | $142,600 | $33,900 | $108,700 |
| 2016 | $11,156 | $142,600 | $33,900 | $108,700 |
| 2015 | $10,826 | $142,600 | $33,900 | $108,700 |
| 2014 | $10,532 | $142,600 | $33,900 | $108,700 |
Source: Public Records
Map
Nearby Homes
- 401 S Us Hwy
- 542 W 6th St
- 720 Madison Ave Unit 22
- 409 John St Unit 11
- 429 John St
- 614 W 8th St Unit 10
- 560 W Front St
- 647 S 2nd St
- 946 Central Ave
- 681 W 3rd St Unit 83
- 911 Plainfield Ave Unit 13
- 911 13 Plainfield Ave
- 401 Highway22b21u3ondo
- 401 Highway22b25u4ondo Unit 25D
- 125 Lafayette Place Unit 27
- 29 Pearl St
- 818-20 2nd Place
- 28 Harmony St
- 413 W 8th St
- 37 Harmony St
- 412 New St Unit 16
- 405 New St
- 411 New St Unit 13
- 418 W 5th St Unit 20
- 407 New St Unit 9
- 76-80 Mercer Unit 3
- 422 W 5th St Unit 24
- 422-24 W 5th St Unit 4
- 411-13 New St
- 426-28 W 5th St
- 426 W 5th St Unit 28
- 430 W 5th St
- 432 W 5th St
- 422 W 4th St Unit 24
- 434 W 5th St
- 435-437 W 5th St
- 436 W 5th St
- 414 Central Ave Unit 16
- 418 Central Ave Unit 20
- 438 W 5th St